Fig. 10
Download original image
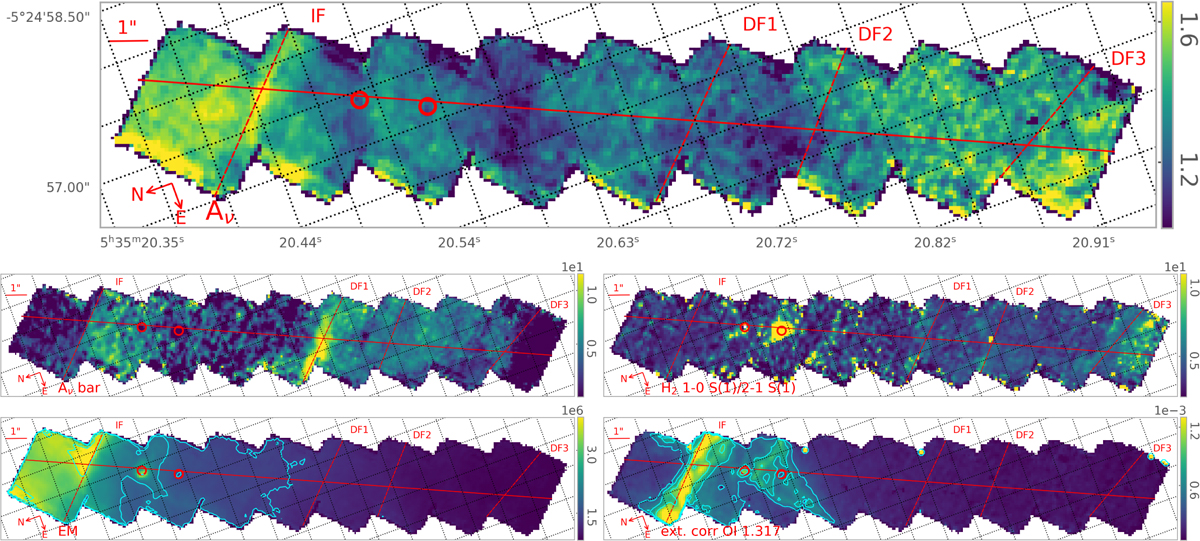
Maps of the visual line of sight foreground extinction AV (Sect. 6.1, top), the visual line of sight internal PDR extinction ![]() (Sect. 6.4, middle left), the H2 1−0 S(1)/2−1 S(1) ratio (Sect. 6.4, midle right), the Emission Measure (EM; in units of pc cm−6, Sect. 6.1, bottom left), and the extinction corrected O I 1.317 µm (ext. corr. O I 1.317 µm; in units of erg cm−2 s−1 sr−1, bottom right). We set the colour range from the bottom 0.5% to the top 99.5% of data for each map, excluding values of zero, edge pixels, and the two proplyds. White pixels inside the mosaic indicate values of zero reflecting issues with the data. The nearly horizontal red line indicates the NIRSpec cut and the nearly vertical red lines indicate from left to right the IF and the DFs (DF 1, DF 2, DF 3). The two proplyds are indicated by the circles. Contours show the 55, 78, and 98% of the data for EM, and 77.9, 90.2, and 96 for O I 1.317 µm (see acknowledgments for data availability).
(Sect. 6.4, middle left), the H2 1−0 S(1)/2−1 S(1) ratio (Sect. 6.4, midle right), the Emission Measure (EM; in units of pc cm−6, Sect. 6.1, bottom left), and the extinction corrected O I 1.317 µm (ext. corr. O I 1.317 µm; in units of erg cm−2 s−1 sr−1, bottom right). We set the colour range from the bottom 0.5% to the top 99.5% of data for each map, excluding values of zero, edge pixels, and the two proplyds. White pixels inside the mosaic indicate values of zero reflecting issues with the data. The nearly horizontal red line indicates the NIRSpec cut and the nearly vertical red lines indicate from left to right the IF and the DFs (DF 1, DF 2, DF 3). The two proplyds are indicated by the circles. Contours show the 55, 78, and 98% of the data for EM, and 77.9, 90.2, and 96 for O I 1.317 µm (see acknowledgments for data availability).
Current usage metrics show cumulative count of Article Views (full-text article views including HTML views, PDF and ePub downloads, according to the available data) and Abstracts Views on Vision4Press platform.
Data correspond to usage on the plateform after 2015. The current usage metrics is available 48-96 hours after online publication and is updated daily on week days.
Initial download of the metrics may take a while.