Fig. 1
Download original image
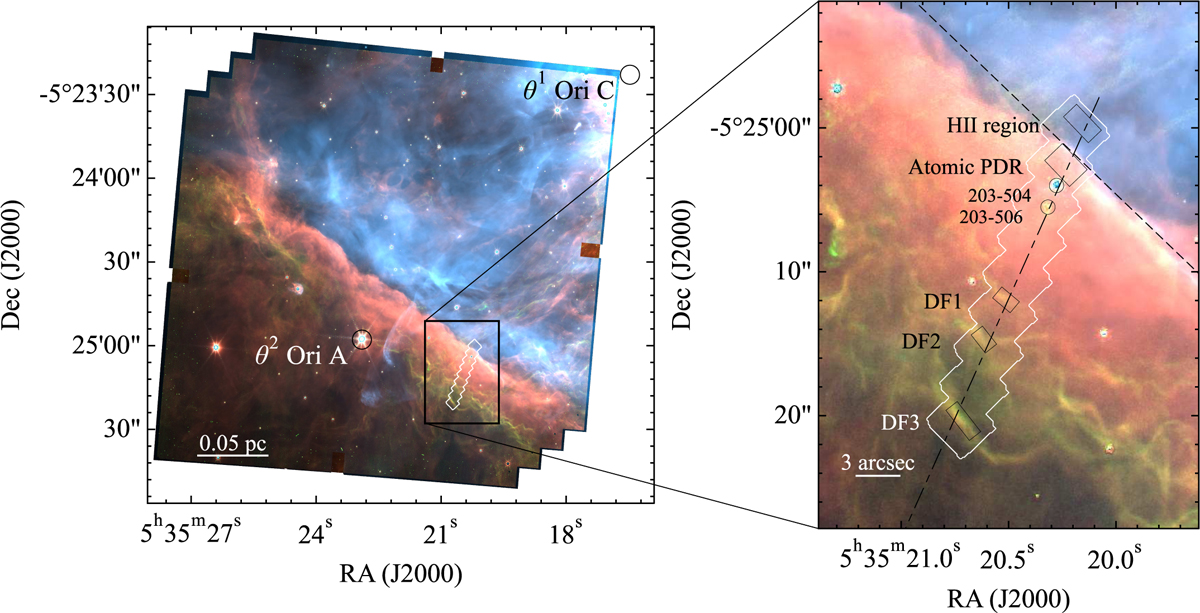
Composite NIRCam image of the Bar showing the NIRSpec mosaic footprint (white boundary). The composite image is composed of F335M (AIB emission) in red, F470N-F480M (H2 emission) in green, and F187N (Paschen α emission) in blue (Habart et al. 2024). Bright stars θ1 Ori C and θ2 Ori A are indicated with black circles in the left panel. In the right panel the five black boxes indicate the apertures used to extract our five template spectra. The dot-dashed line indicates the cut perpendicular to the Bar (position angle, PA, of 155.79°), while the dashed line indicates the position of the ionisation front in the NIRSpec FOV (PA=46.2l°). The protoplanetary disks 203–504 and 203–506 are indicated with black circles.
Current usage metrics show cumulative count of Article Views (full-text article views including HTML views, PDF and ePub downloads, according to the available data) and Abstracts Views on Vision4Press platform.
Data correspond to usage on the plateform after 2015. The current usage metrics is available 48-96 hours after online publication and is updated daily on week days.
Initial download of the metrics may take a while.