Fig. 2.

Download original image
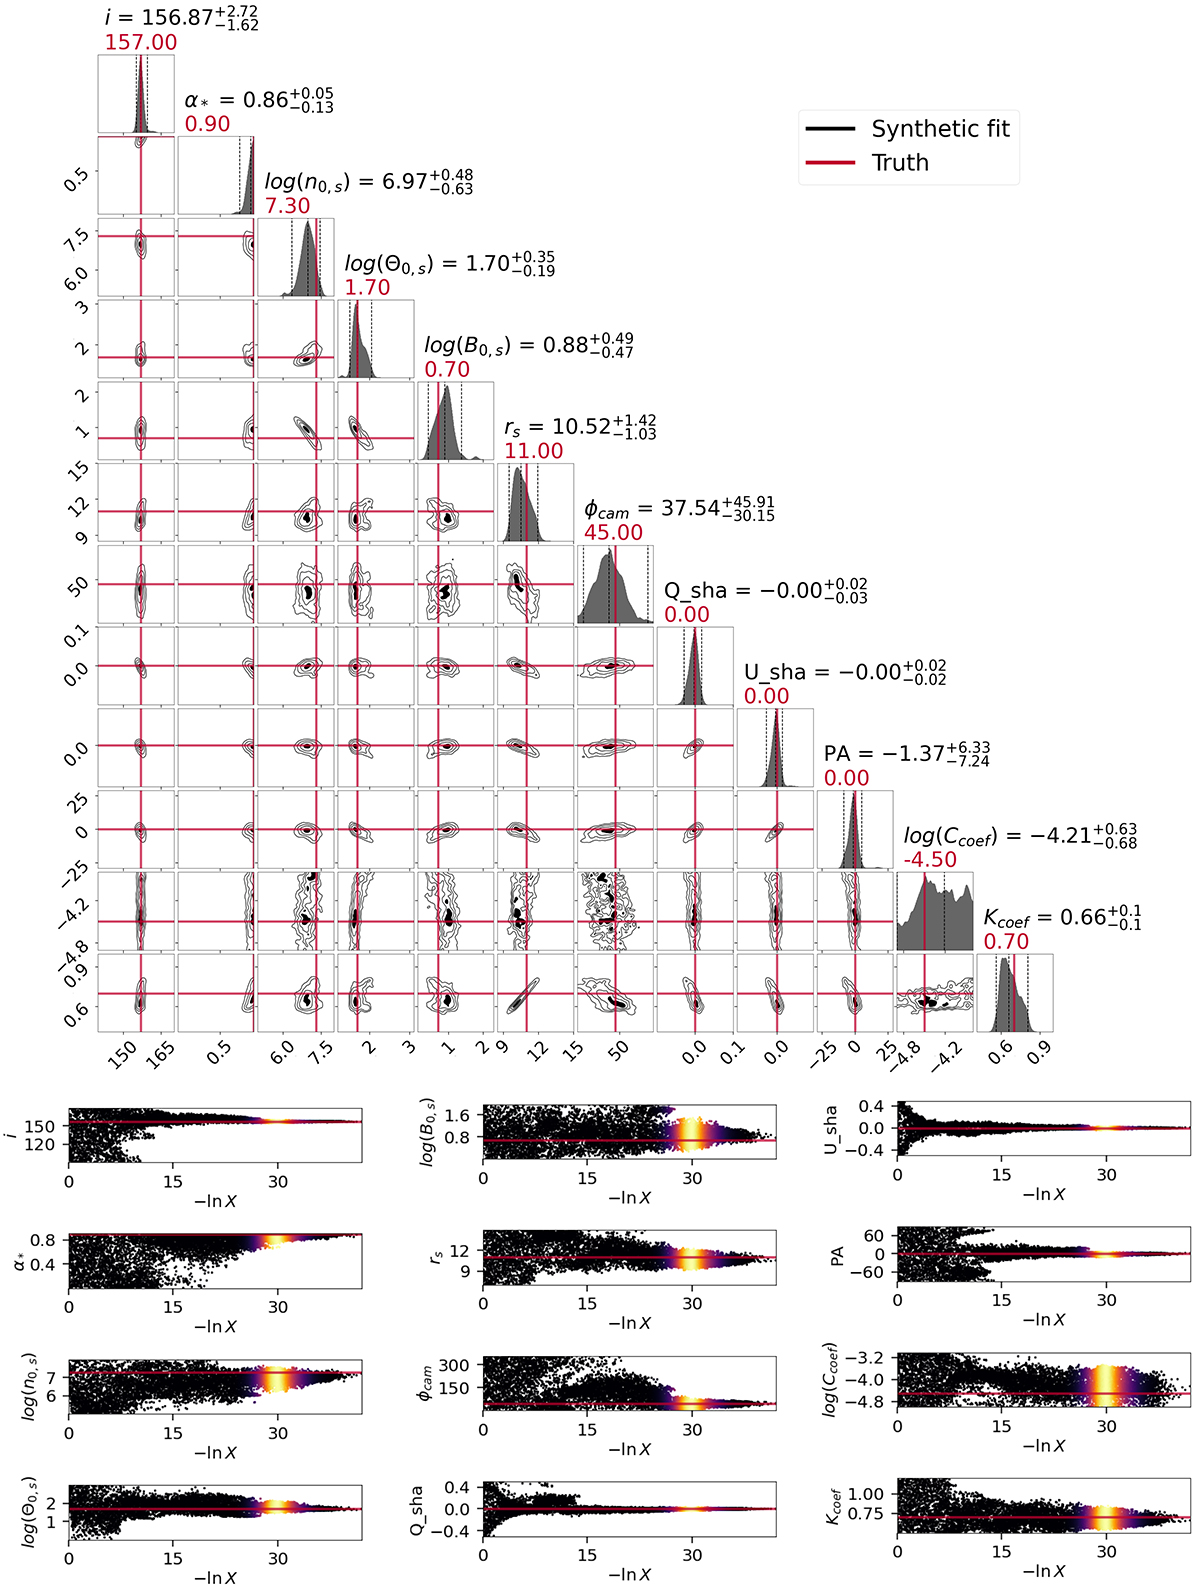
Triangle and trace plots of the synthetic light-curve fitting. Top: Triangle plot, a combination of 1D and 2D marginalized posteriors, with the dashed lines denoting the median and 2σ or (90%) confidence levels (left and right). Similarly, the contours are for 90% (outer) and then 50% and 25% confidence levels. The truth is marked with red lines. Bottom: Trace plots showing the evolution of particles (and their marginal posterior distributions) in 1D projections, where lnX denotes the prior volume of the parameter space. The dots are color-coded with respect to their relative posterior mass, meaning that bright yellow values are present when convergence is achieved.
Current usage metrics show cumulative count of Article Views (full-text article views including HTML views, PDF and ePub downloads, according to the available data) and Abstracts Views on Vision4Press platform.
Data correspond to usage on the plateform after 2015. The current usage metrics is available 48-96 hours after online publication and is updated daily on week days.
Initial download of the metrics may take a while.


