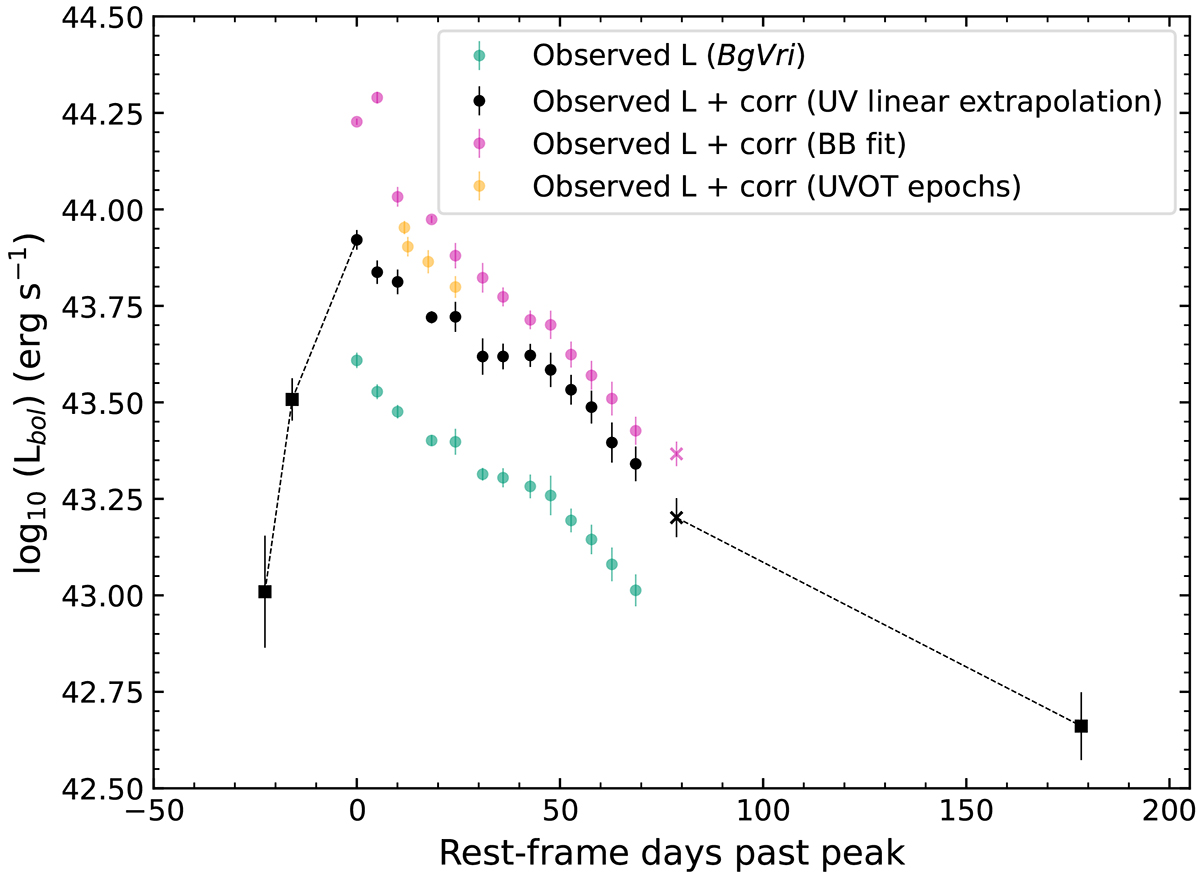
Fig. 8.

Download original image
Bolometric light curve of SN 2020zbf with different corrections applied. The circles correspond to the derived luminosities using all LCO filters, the crosses are the Vri bands and the square symbols illustrate the bolometric luminosity assuming the same bolometric correction as the epochs with multiband data. The green light curve corresponds to the integrated observed BgVri flux and constitutes a lower limit on the total bolometric luminosity. The black symbols include a correction to the NIR and the UV using the UV linear extrapolation method (Lyman et al. 2014), whereas the purple light curve considers a UV correction by integrating the blackbody fit. The orange data points show the observed bolometric luminosity including the NIR correction if we consider also the UVOT data. The errors represent statistical errors. For our analysis we used the black curve, and the dashed lines connect the correction data points for illustration purposes.
Current usage metrics show cumulative count of Article Views (full-text article views including HTML views, PDF and ePub downloads, according to the available data) and Abstracts Views on Vision4Press platform.
Data correspond to usage on the plateform after 2015. The current usage metrics is available 48-96 hours after online publication and is updated daily on week days.
Initial download of the metrics may take a while.


