Fig. 5.
Download original image
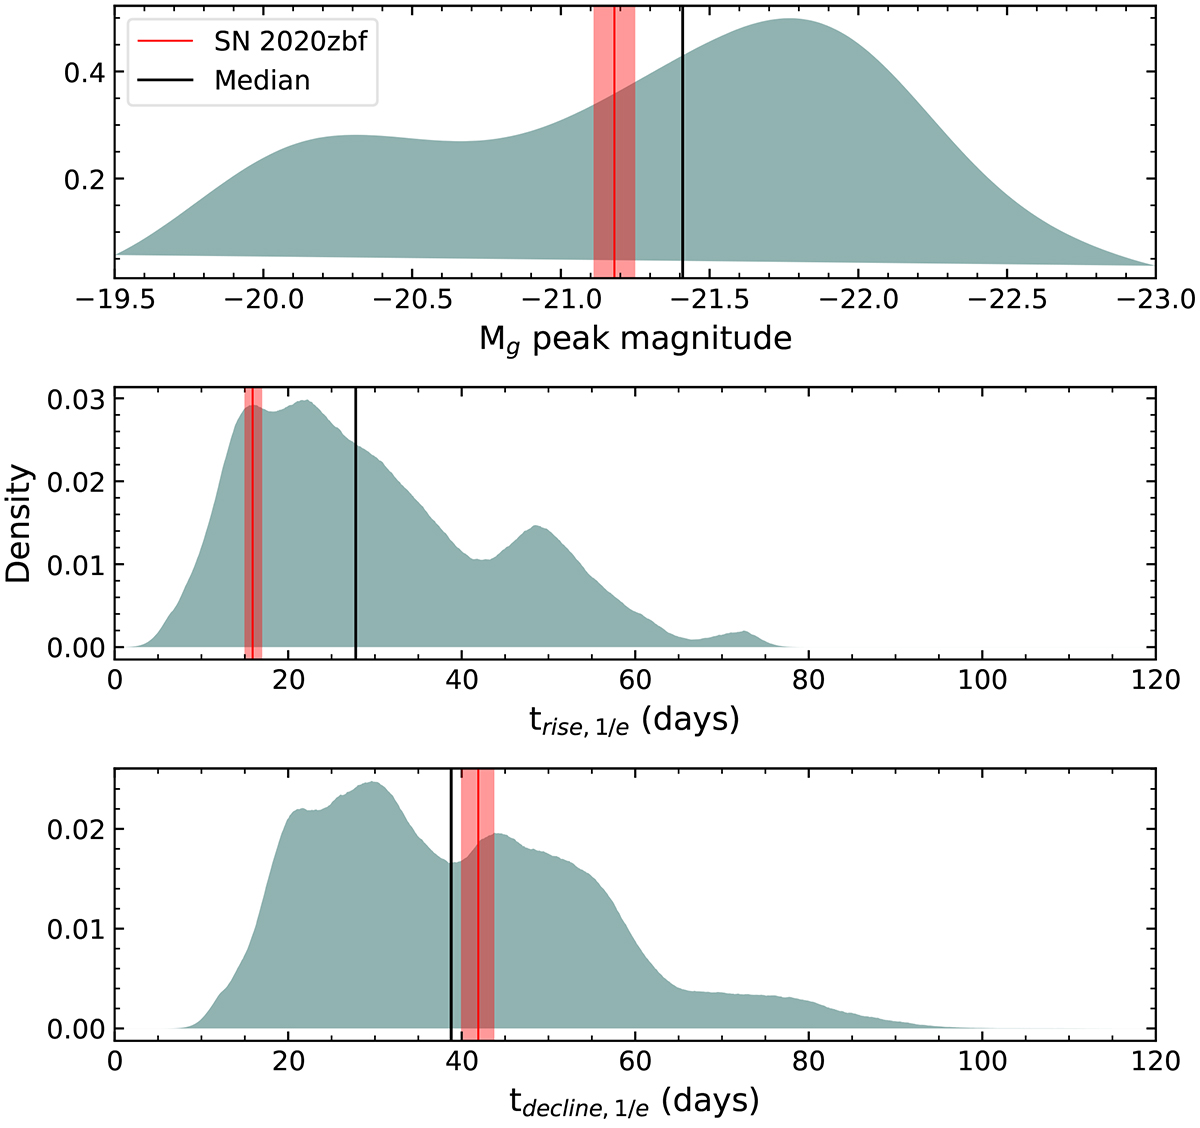
Comparison of the photometric properties of SN 2020zbf with the ZTF SLSN-I sample (Chen et al. 2023a). Top: KDE distribution of the Mg peak magnitudes for 78 ZTF SLSNe-I. Middle: KDE plot of the e-folding rise time for 69 ZTF SLSNe-I. Bottom: e-folding decline time distribution for 54 ZTF SLSNe-I. The vertical red line along with the errors (shaded red regions) illustrate the position of SN 2020zbf and the black vertical lines the median values.
Current usage metrics show cumulative count of Article Views (full-text article views including HTML views, PDF and ePub downloads, according to the available data) and Abstracts Views on Vision4Press platform.
Data correspond to usage on the plateform after 2015. The current usage metrics is available 48-96 hours after online publication and is updated daily on week days.
Initial download of the metrics may take a while.