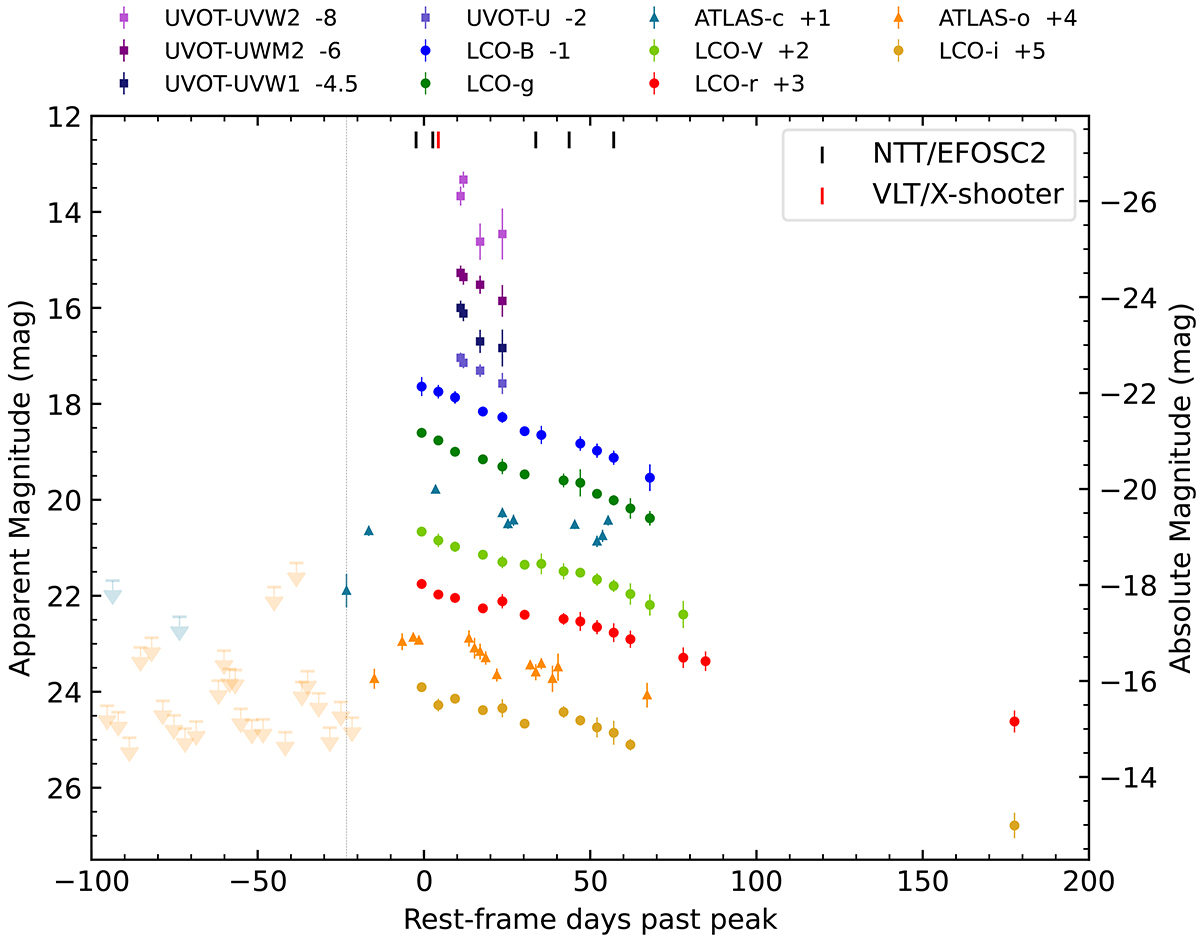
Fig. 3.
Download original image
UV and optical light curves of SN 2020zbf. The magnitudes are corrected for MW extinction and cosmological K-correction. Upper limits are presented as downward-pointing triangles in a lighter shade. The phase of the first detection is marked with a vertical dashed line and the epochs of the spectra are marked as thick lines at the top of the figure. The zero value on the x-axis is with respect to the g-band maximum (MJD 59 164.8).
Current usage metrics show cumulative count of Article Views (full-text article views including HTML views, PDF and ePub downloads, according to the available data) and Abstracts Views on Vision4Press platform.
Data correspond to usage on the plateform after 2015. The current usage metrics is available 48-96 hours after online publication and is updated daily on week days.
Initial download of the metrics may take a while.