Fig. 16.
Download original image
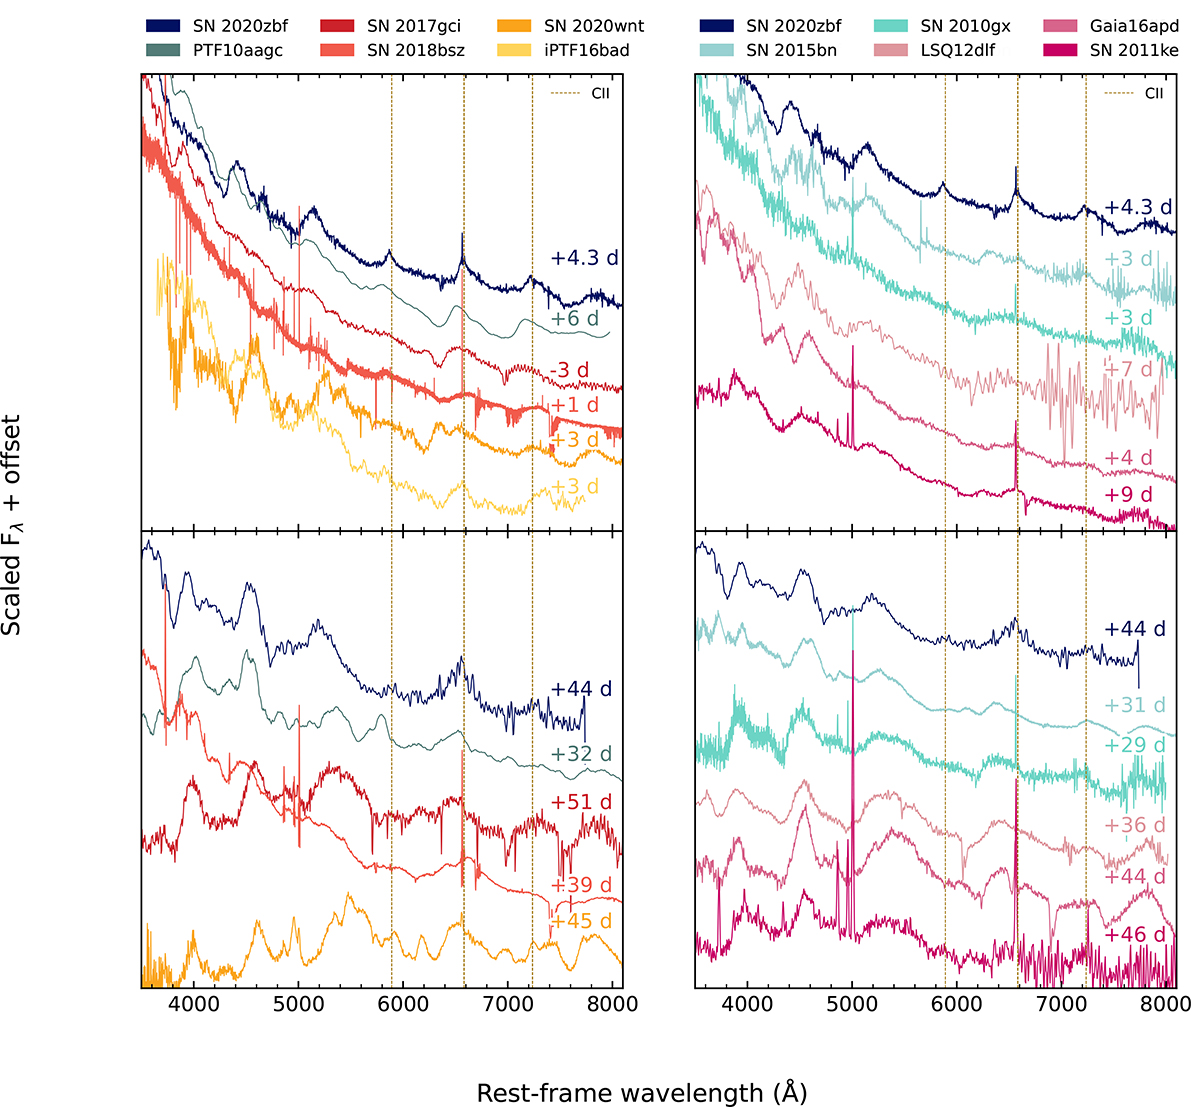
Spectral comparison of SN 2020zbf with SLSNe-I from the literature. Left: SN 2020zbf spectra in comparison with C-rich SLSNe-I at around peak (top) and ∼30–50 days after peak (bottom). Right: comparison of SN 2020zbf spectra with typical well-studied SLSNe-I at the same epochs. The spectra are corrected for MW extinction. The spectra of SN 2020zbf, SN 2018bsz, iPTF16bad and LSQ12dlf have been smoothed using a Savitzky-Golay filter. The vertical gold dashed lines indicate the rest wavelengths of the C II emission lines.
Current usage metrics show cumulative count of Article Views (full-text article views including HTML views, PDF and ePub downloads, according to the available data) and Abstracts Views on Vision4Press platform.
Data correspond to usage on the plateform after 2015. The current usage metrics is available 48-96 hours after online publication and is updated daily on week days.
Initial download of the metrics may take a while.