Fig. 13.
Download original image
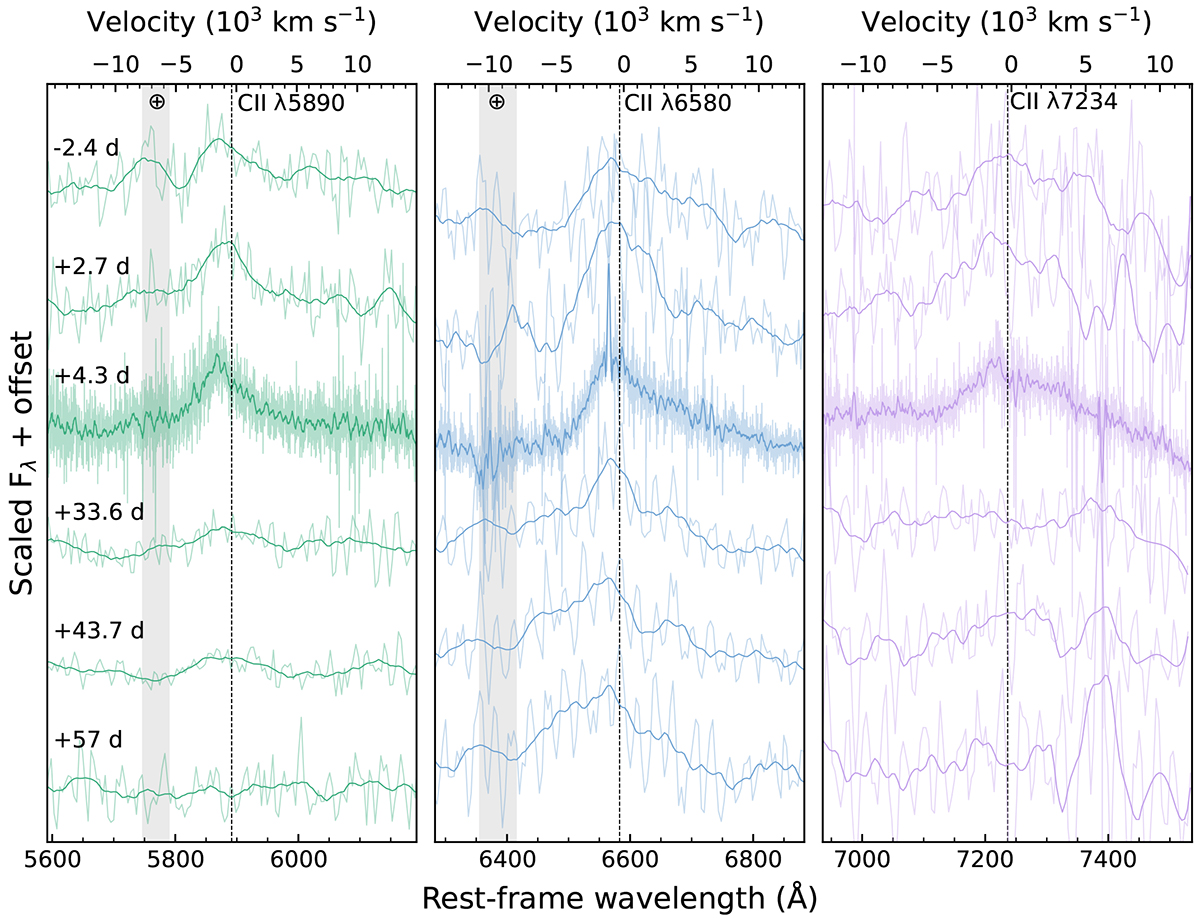
Evolution of the three C II lines of SN 2020zbf from −2.4 to +57 rest-frame days. The telluric absorptions are indicated with lighter gray vertical bands. The spectra have been corrected for extinction. A smoothing has been applied utilizing the Savitzky-Golay filter and the original data are shown in lighter colors. The regions corrected for telluric absorptions are indicated with lighter gray vertical lines. A local linear continuum subtraction and an offset were applied for display purposes. The rest-frame wavelengths of the C II lines are illustrated with dashed vertical lines.
Current usage metrics show cumulative count of Article Views (full-text article views including HTML views, PDF and ePub downloads, according to the available data) and Abstracts Views on Vision4Press platform.
Data correspond to usage on the plateform after 2015. The current usage metrics is available 48-96 hours after online publication and is updated daily on week days.
Initial download of the metrics may take a while.