Fig. 12.
Download original image
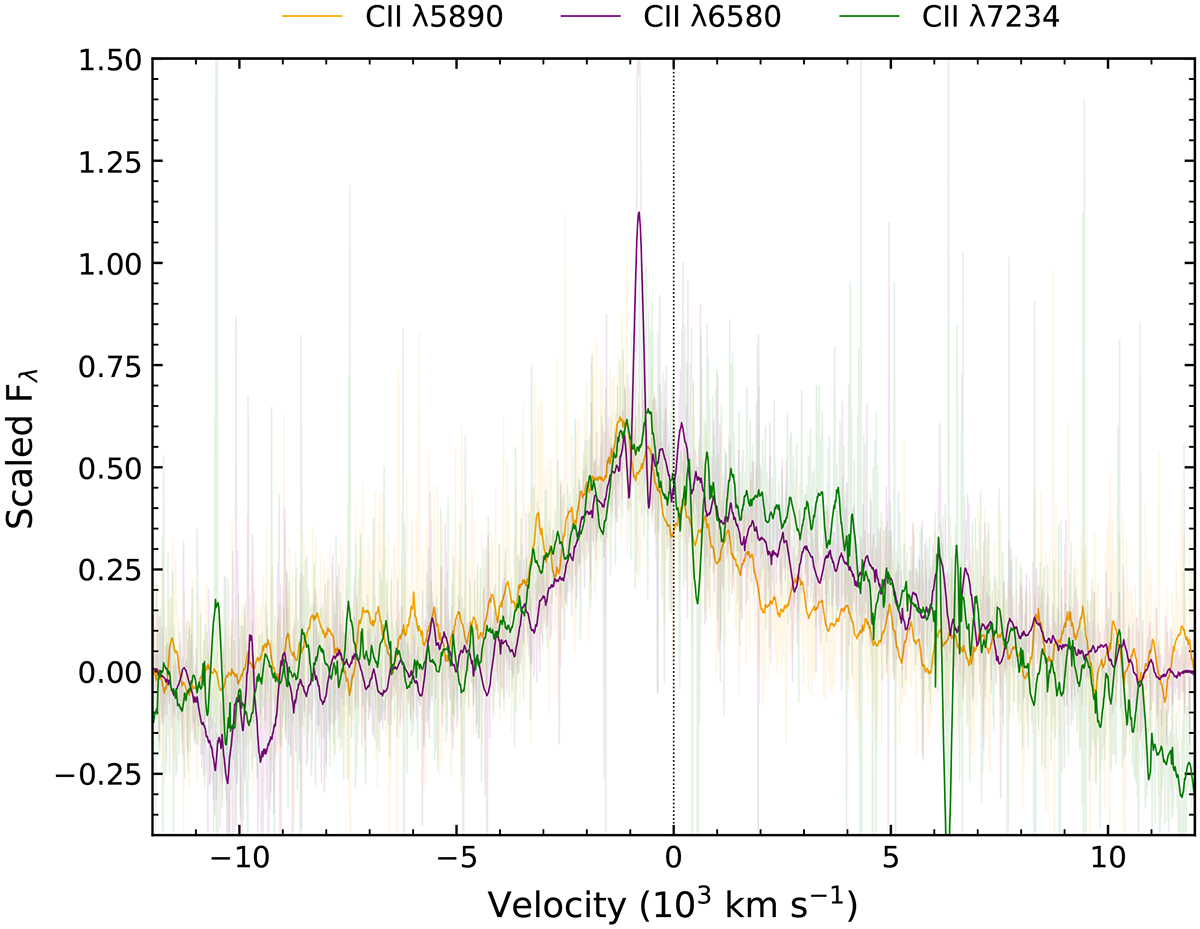
Three C II emission lines detected in the X-shooter spectrum +4.3 days after peak. A local linear continuum subtraction and a normalization to the peak flux has been applied for illustration purposes. The spectra have been smoothed using a Savitzky-Golay filter while the original data are shown in a lighter color. The rest-frame wavelength of the C II emission is denoted by the dashed vertical line. Note that the narrow emission component at 6580 Å is the Hα emission from the host galaxy.
Current usage metrics show cumulative count of Article Views (full-text article views including HTML views, PDF and ePub downloads, according to the available data) and Abstracts Views on Vision4Press platform.
Data correspond to usage on the plateform after 2015. The current usage metrics is available 48-96 hours after online publication and is updated daily on week days.
Initial download of the metrics may take a while.