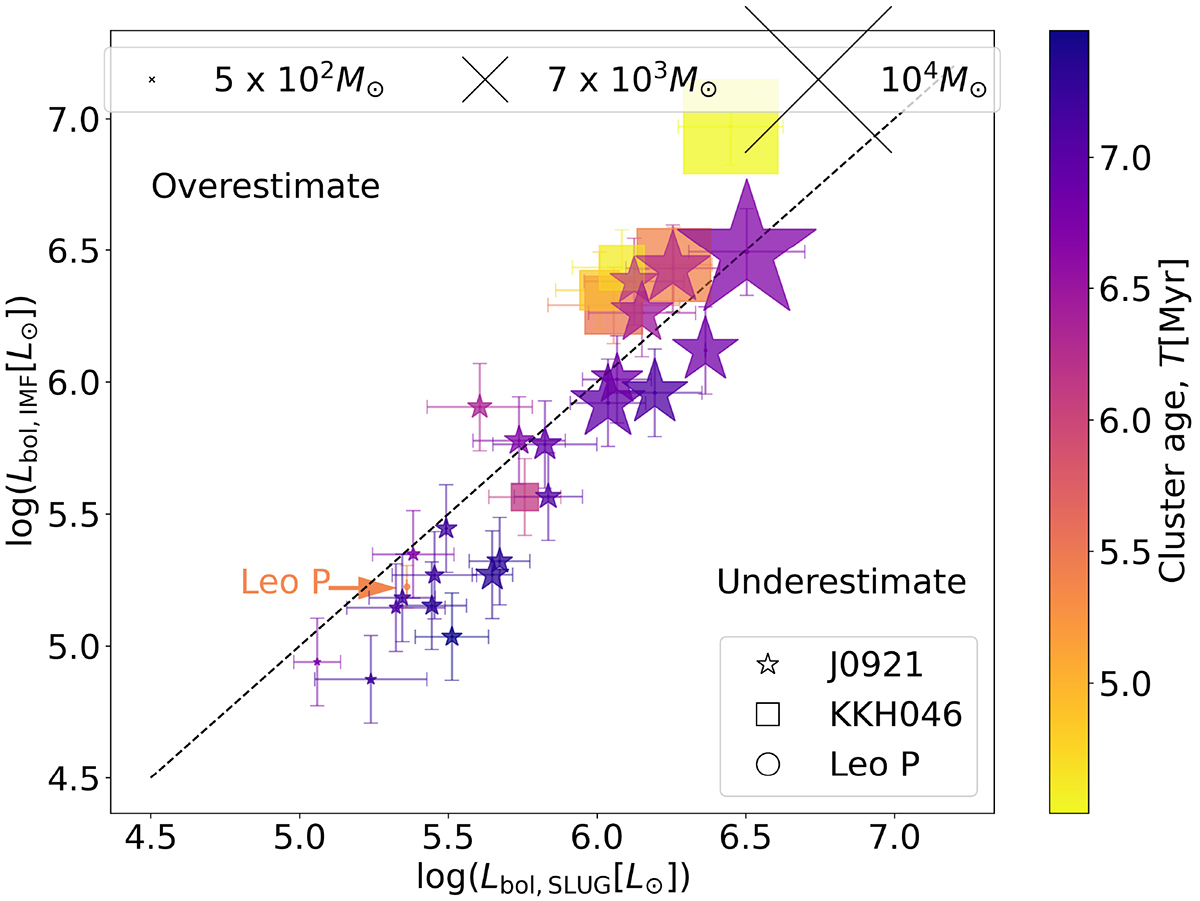
Fig. 9.
Download original image
Comparison plot for the two methods used to calculate the bolometric luminosity for the 30 HII regions in this sample, where for Lbol, IMF we have assumed a fully sampled IMF, and for Lbol, SLUG we have used the median of the posterior PDF returned by SLUG. The colours indicate the age of the regions, and the size of each point is a representation of their mass. The dashed black line indicates where these values are equivalent; points above this line show where Lbol, IMF is greater than Lbol, SLUG – that is to say, where assuming a fully sampled IMF with Eq. (2) overestimates the bolometric luminosity. The Leo P data point has been labelled for visual clarity.
Current usage metrics show cumulative count of Article Views (full-text article views including HTML views, PDF and ePub downloads, according to the available data) and Abstracts Views on Vision4Press platform.
Data correspond to usage on the plateform after 2015. The current usage metrics is available 48-96 hours after online publication and is updated daily on week days.
Initial download of the metrics may take a while.