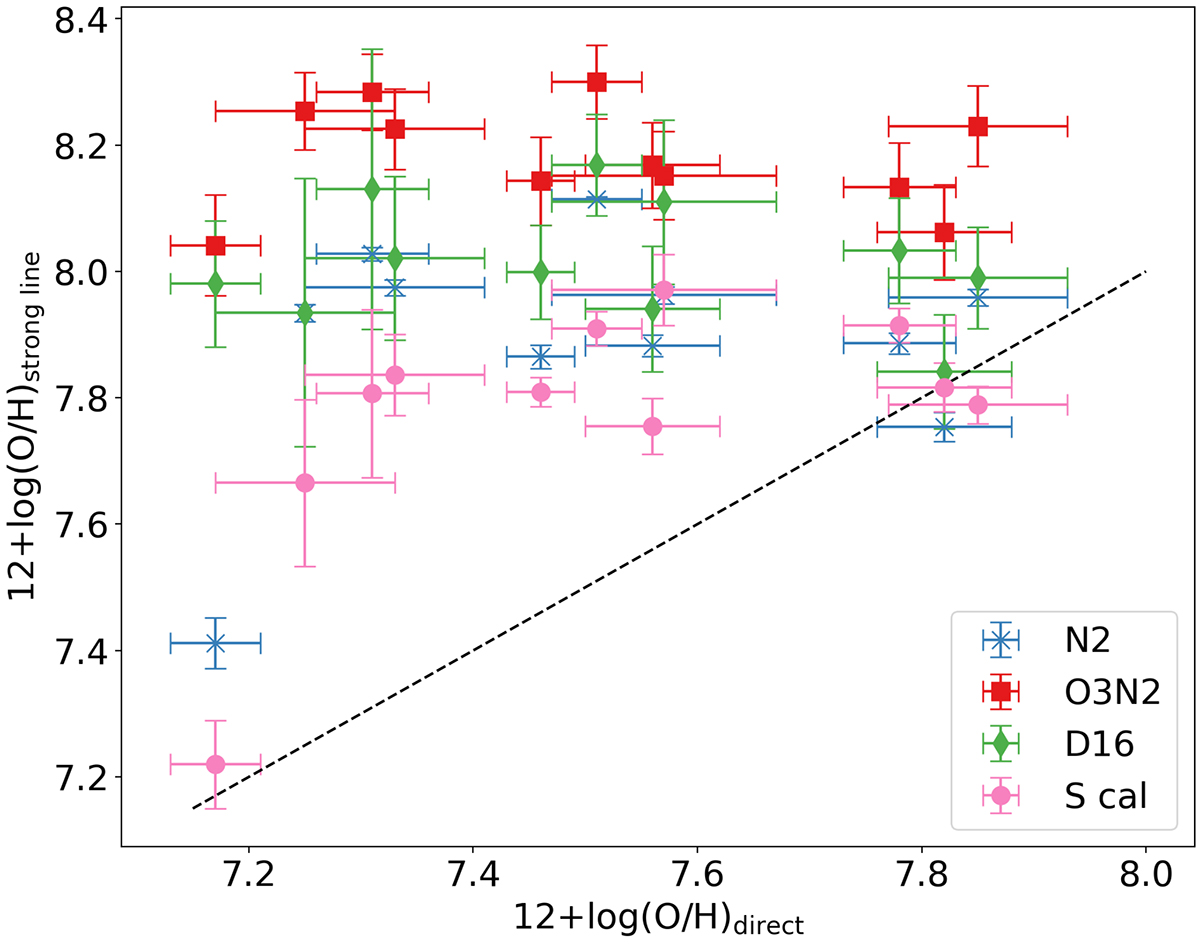
Fig. 7.
Download original image
Oxygen abundances as determined from the strong-line calibration methods described in the Sect. 4.3 against the direct method oxygen abundance for ten regions in J0921 (from J20) and the Leo P HII region (taken from Skillman et al. 2013), with the single Leo P region having the lowest 12 + log(O/H)direct. The dashed black line indicates where the derived abundances are equivalent to the direct, temperature-based values.
Current usage metrics show cumulative count of Article Views (full-text article views including HTML views, PDF and ePub downloads, according to the available data) and Abstracts Views on Vision4Press platform.
Data correspond to usage on the plateform after 2015. The current usage metrics is available 48-96 hours after online publication and is updated daily on week days.
Initial download of the metrics may take a while.