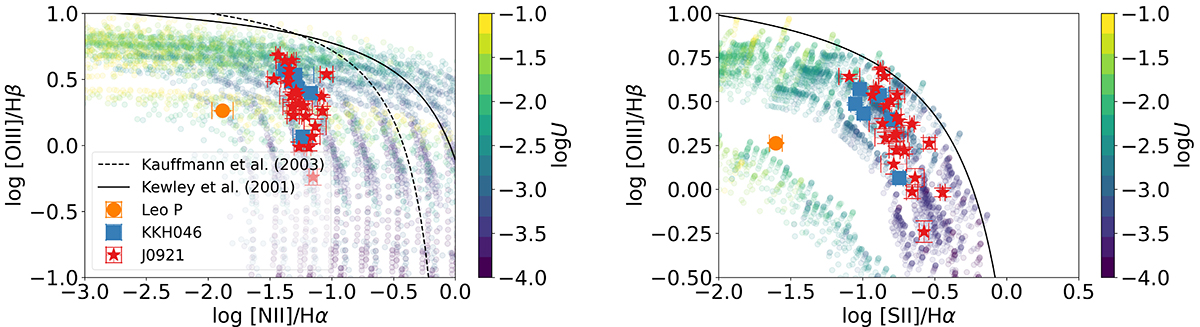
Fig. 4.
Download original image
Classical emission line diagnostic diagrams of the HII regions defined in this paper. Theoretical maximum starburst lines plotted by the solid and dashed black lines are taken from literature (Kewley et al. 2001; Kauffmann et al. 2003, respectively). Low-metallicity photoionisation models from CLOUDY are also plotted, coloured by ionisation parameter (log U).
Current usage metrics show cumulative count of Article Views (full-text article views including HTML views, PDF and ePub downloads, according to the available data) and Abstracts Views on Vision4Press platform.
Data correspond to usage on the plateform after 2015. The current usage metrics is available 48-96 hours after online publication and is updated daily on week days.
Initial download of the metrics may take a while.