Fig. A.2.
Download original image
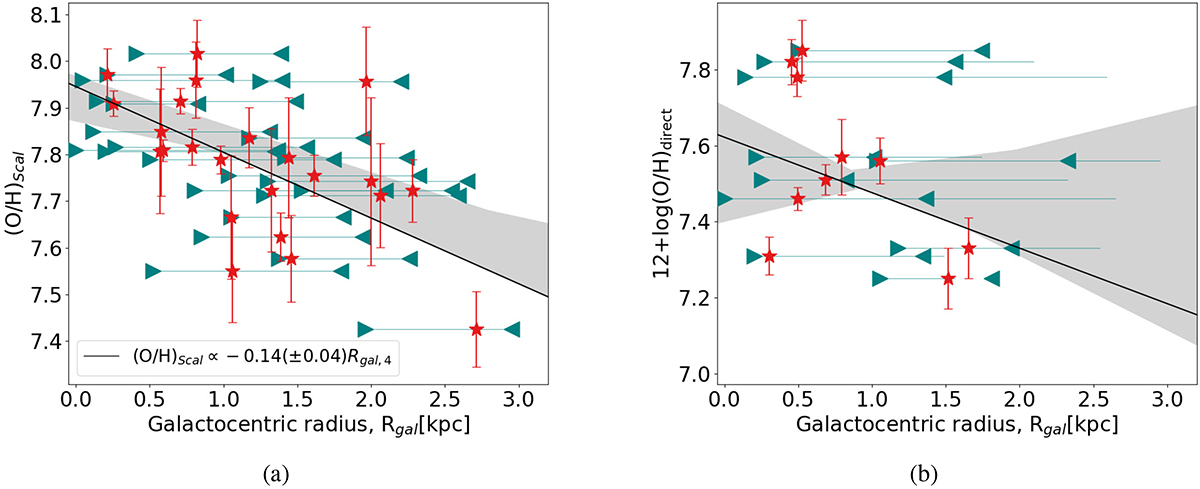
Panel (a): Oxygen abundance against projected galactocentric distance for the 23 HII regions within J0921. Horizontal teal lines indicate the change in the position of each region when different galactic centres were used, and the shaded grey area shows the spread of metallicity gradients for the five galactic centres tested. The points plotted in red are for the fourth centre, which is the geometric centre of all pixels containing Hα emission above three standard deviations. Panel (b): Similar to panel (a) but with the direct method oxygen abundance for the ten regions from J20.
Current usage metrics show cumulative count of Article Views (full-text article views including HTML views, PDF and ePub downloads, according to the available data) and Abstracts Views on Vision4Press platform.
Data correspond to usage on the plateform after 2015. The current usage metrics is available 48-96 hours after online publication and is updated daily on week days.
Initial download of the metrics may take a while.