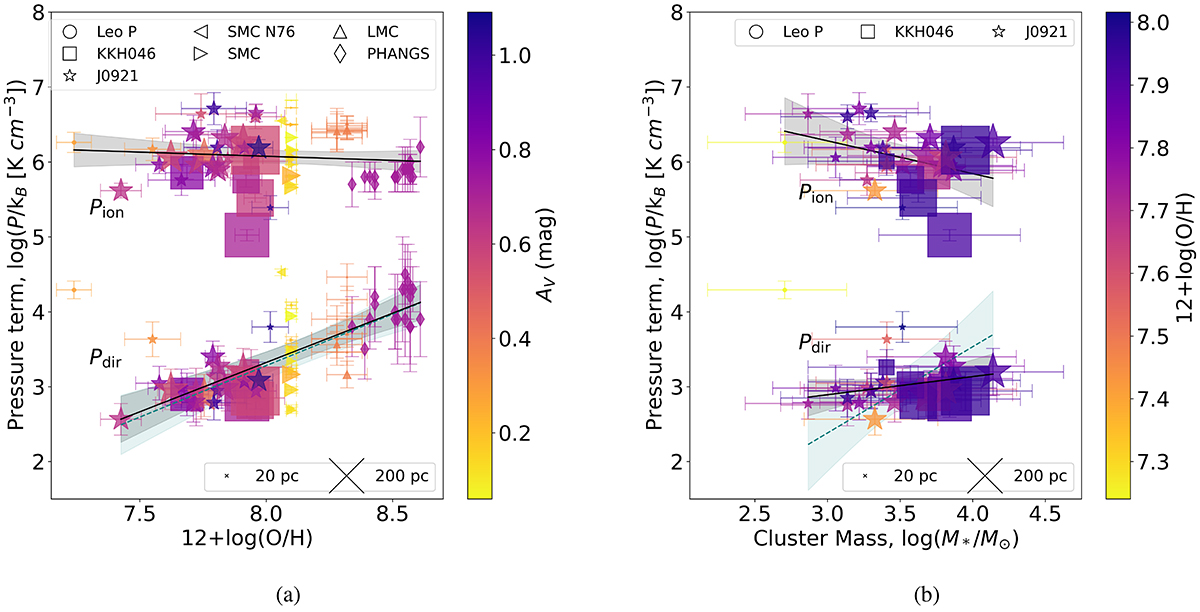
Fig. 12.
Download original image
Panel a: similar to Fig. 10a, but with the pressure components plotted as a function of their oxygen abundance, 12 + log(O/H), with all markers coloured by their extinction and sized according to the HII region radii, where we take the median radii and extinction for the PHANGS data points (Barnes et al. 2021). Panel b: similar to panel a, but with only the 30 HII regions from the three dwarfs in this sample plotted against their cluster mass and coloured by their oxygen abundance.
Current usage metrics show cumulative count of Article Views (full-text article views including HTML views, PDF and ePub downloads, according to the available data) and Abstracts Views on Vision4Press platform.
Data correspond to usage on the plateform after 2015. The current usage metrics is available 48-96 hours after online publication and is updated daily on week days.
Initial download of the metrics may take a while.