Fig. 10.
Download original image
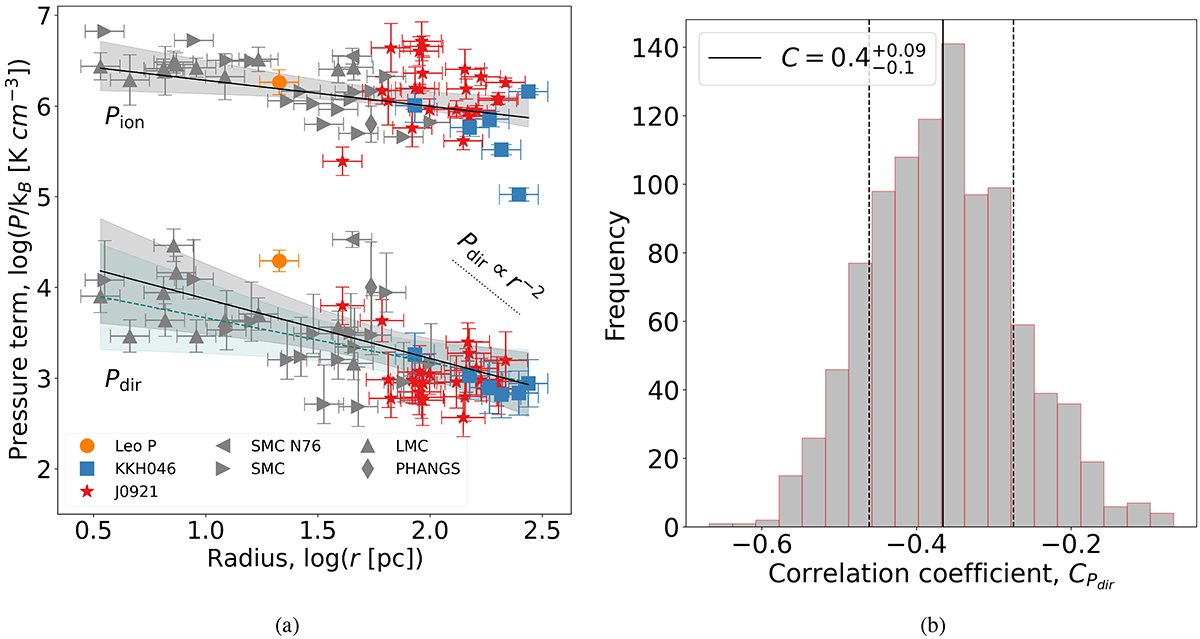
Panel a: photoionisation pressure (Pion) and direct radiation pressure (Pdir) of the HII regions in various galaxies (see legend) plotted as a function of region size. The Pion values occupy the top half of the plot, and Pdir values the bottom half. SMC points are taken from Lopez et al. (2014), SMC N76 from McLeod et al. (in prep.), and the LMC points from McLeod et al. (2019). We note that uncertainties in the radii values are not given in the literature, and we therefore assume a generous 20%. We also plotted the median values from the PHANGS-MUSE survey as given in Barnes et al. (2021) by the grey diamond marker. The solid black lines indicate the linear best fits for Pion and Pdir, SLUG, with shaded grey areas for the 95% confidence regions. The dashed teal line and shaded area depict the linear fit when using Pdir, IMF. The black dotted line indicates the r−2 proportionality from Eq. (6) used to calculate Pdir. Panel b: correlation coefficient analysis for the Pdir, SLUG − log10(r) relation (see Sect. 7). The histogram shows the probability density distribution of the Pearson correlation coefficient using the bootstrapping and perturbation method from Curran (2014). The solid black line is the median correlation coefficient, C, found for this relation and the dashed lines show the 16th and 84th percentiles used to determine the uncertainty.
Current usage metrics show cumulative count of Article Views (full-text article views including HTML views, PDF and ePub downloads, according to the available data) and Abstracts Views on Vision4Press platform.
Data correspond to usage on the plateform after 2015. The current usage metrics is available 48-96 hours after online publication and is updated daily on week days.
Initial download of the metrics may take a while.