Fig. 4.
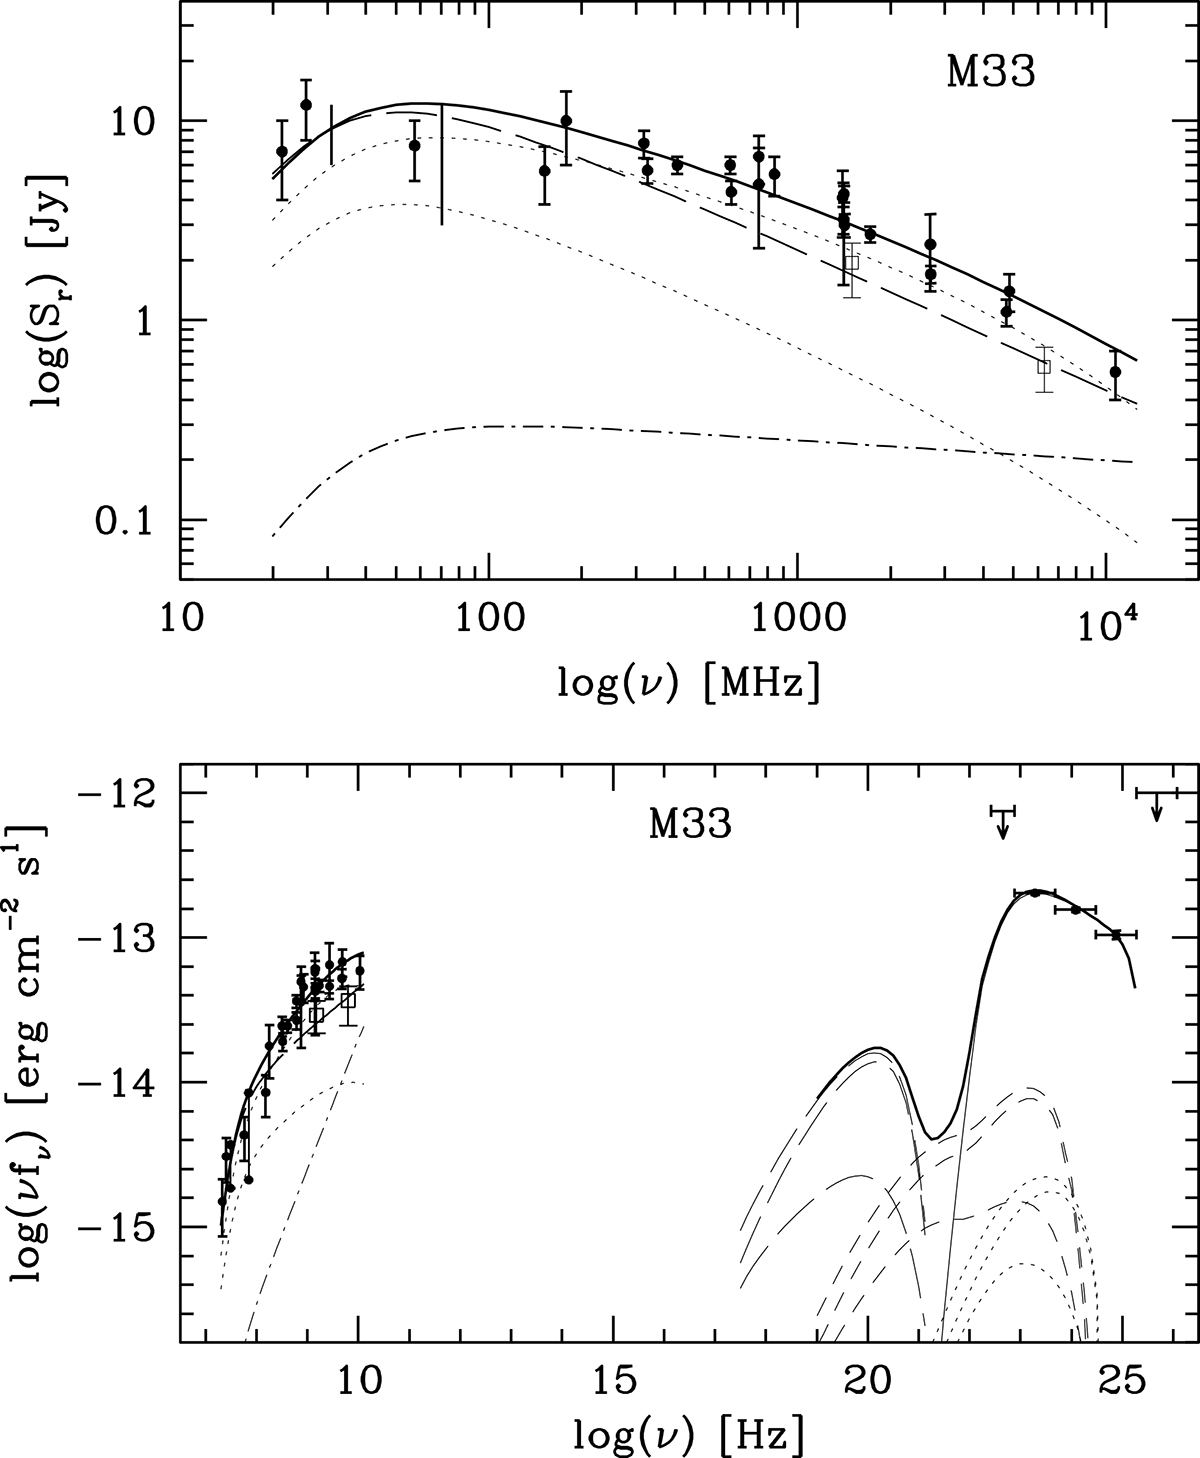
Download original image
SED of M33. Radio spectrum (top): the emission model (solid curve), including primary and secondary synchrotron radiation (dotted curves of decreasing flux) as well as a thermal free–free component (dot-dashed curve), is overlaid with data from Table 2 (black dots). The empty squares represent the estimated radio flux after removing the contribution from ≤200 pc size sources (Tabatabaei et al. 2022). The total radio emission, resulting if the ‘nominal’ primary electron spectrum is used, is indicated by the dashed curve. Broadband SED (bottom): data points are shown as dots, model predictions as curves. Emission components are plotted by the following line types: radio synchrotron, dotted; thermal free–free emission, dot-dashed; total radio, solid; Comptonised CMB, long-dashed; Comptonised starlight (EBL+FGL), short-dashed; non-thermal bremsstrahlung, dotted; and pionic, solid. For each type of non-thermal leptonic yield, the total, primary, and secondary emissions are denoted as curves of progressively lower flux. In the X-ray and γ-ray range, on top of the separate components, a solid line indicates the total emission. The empty squares and dashed curve in the radio are as described in the top panel.
Current usage metrics show cumulative count of Article Views (full-text article views including HTML views, PDF and ePub downloads, according to the available data) and Abstracts Views on Vision4Press platform.
Data correspond to usage on the plateform after 2015. The current usage metrics is available 48-96 hours after online publication and is updated daily on week days.
Initial download of the metrics may take a while.