Fig. 2.
Download original image
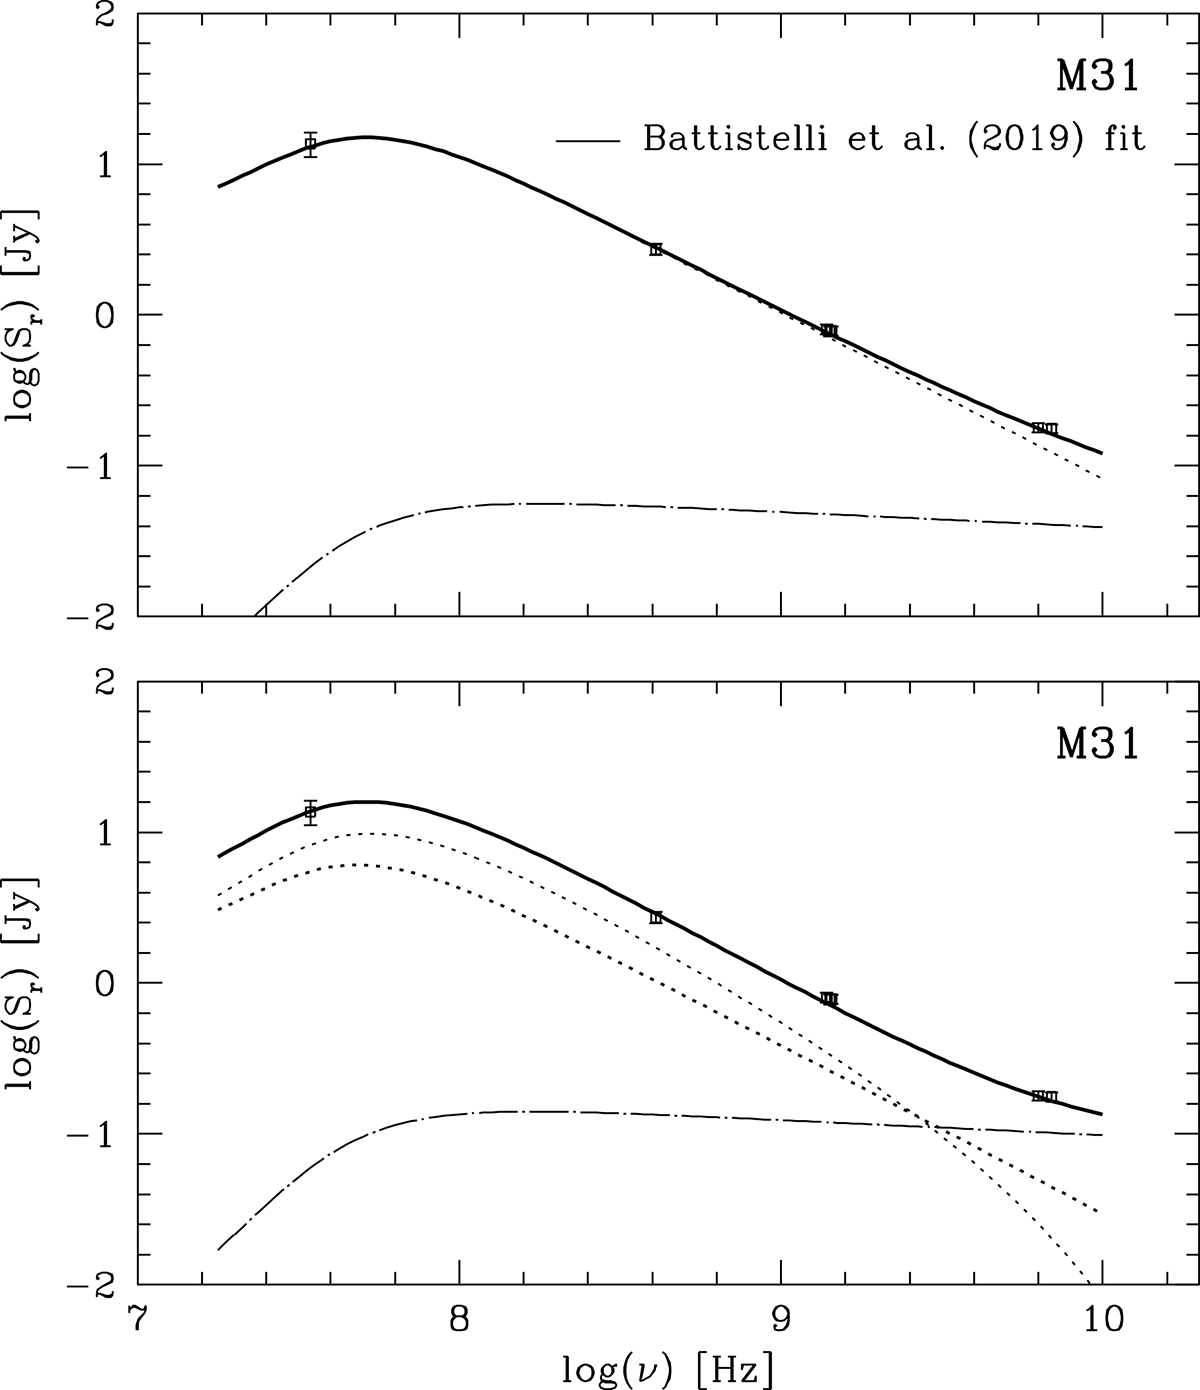
Radio spectrum of M31. The data points (from Battistelli et al. 2019) denote the whole-galaxy radio flux reduced to the estimated flux expected from within the R⋆ radial region as described in the text. Also shown are: (top) Battistelli et al. (2019) fit (single electron population synchrotron: dotted curve; thermal free–free emission: dot-dashed curve), and (bottom) our LH emission model. The latter includes primary and secondary synchrotron radiation (dotted curves of increasing flux at their peaks) and a thermal free–free component (dot-dashed curve).
Current usage metrics show cumulative count of Article Views (full-text article views including HTML views, PDF and ePub downloads, according to the available data) and Abstracts Views on Vision4Press platform.
Data correspond to usage on the plateform after 2015. The current usage metrics is available 48-96 hours after online publication and is updated daily on week days.
Initial download of the metrics may take a while.