Fig. 8.
Download original image
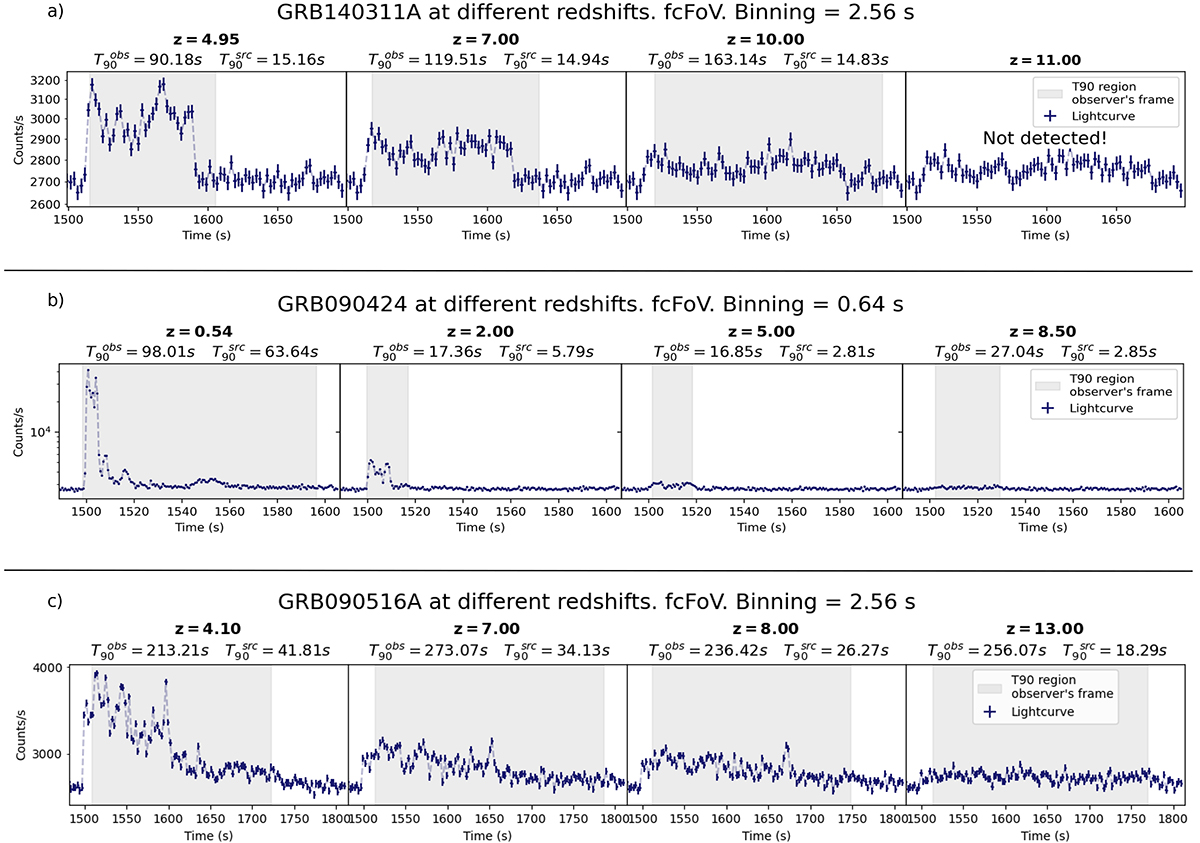
Evolution of the retrieved 4−120 keV light curves at different zsim for a specific position within the fcFoV, for the three GRBs described as case studies. GRB 140311A, GRB 090424, and GRB 090516A are shown in panels a–c respectively. For better visualisation, different binning is used for each GRB, both axes are fixed for all plots in the same panel, and the y-axis is shown in logarithmic scale in panels b and c. The obtained T90 interval is shown with a grey shaded band on each light curve, and the corresponding values written on top, if the detection was successful. These light curves and values correspond to one trial, and hence they may differ from the values given in the text, which correspond to the median of 100 trials.
Current usage metrics show cumulative count of Article Views (full-text article views including HTML views, PDF and ePub downloads, according to the available data) and Abstracts Views on Vision4Press platform.
Data correspond to usage on the plateform after 2015. The current usage metrics is available 48-96 hours after online publication and is updated daily on week days.
Initial download of the metrics may take a while.