Fig. 9
Download original image
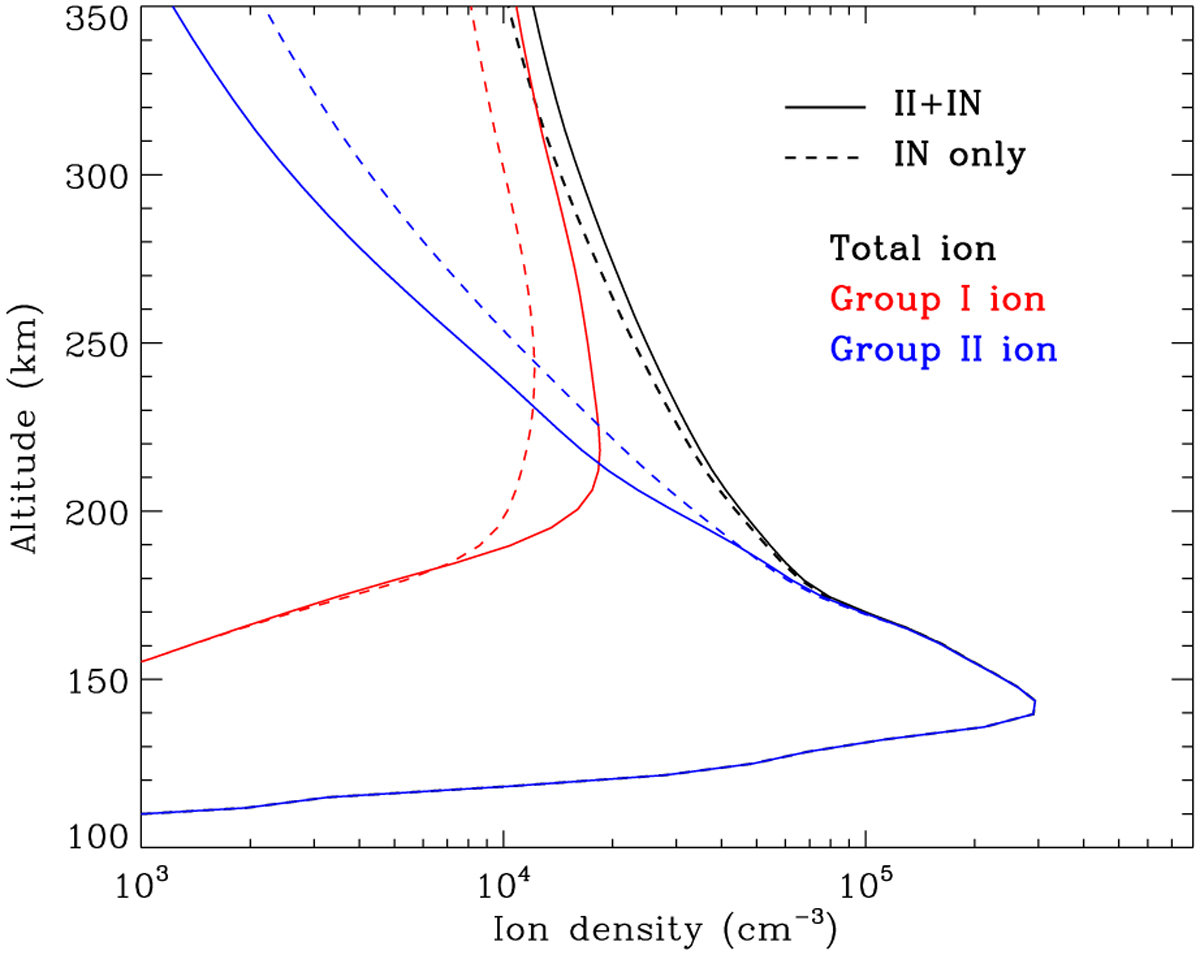
Comparison between two solar minimum model runs, one with ion-neutral (IN) collisions only (dashed) and the other one with both ion-neutral and ion-ion (II) Coulomb collisions (solid). The black lines show the total ion density profiles obtained by the two model runs, whereas the red and blue lines correspond to the density profiles of the group I and II ions, respectively. The former includes all ion species with peak altitudes above 200 km and the latter includes the remaining species.
Current usage metrics show cumulative count of Article Views (full-text article views including HTML views, PDF and ePub downloads, according to the available data) and Abstracts Views on Vision4Press platform.
Data correspond to usage on the plateform after 2015. The current usage metrics is available 48-96 hours after online publication and is updated daily on week days.
Initial download of the metrics may take a while.