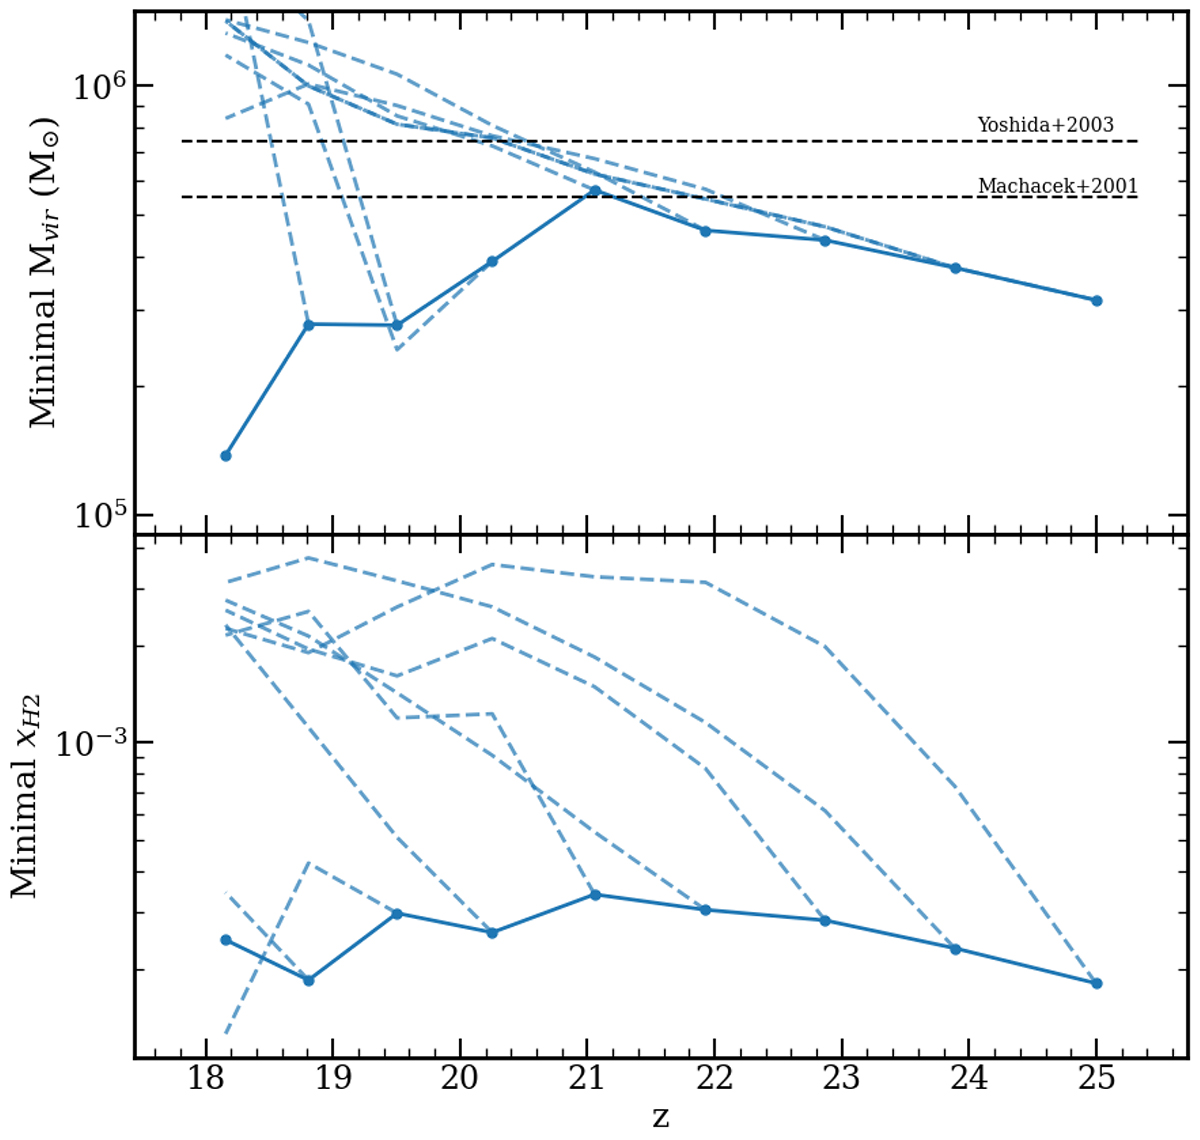
Fig. 9.
Download original image
Minimum mass (top) and minimum xH2 fraction (bottom) of halos hosting clumps in our simulation as a function of redshift. The blue solid lines show the evolution of these minimums and the dashed lines show the subsequent mass or xH2 evolution of the relevant ’minimal’ halo, usually increasing in both mass and H2 fraction. In the top panel, the horizontal lines show the critical mass found by Yoshida et al. (2003) and Machacek et al. (2003).
Current usage metrics show cumulative count of Article Views (full-text article views including HTML views, PDF and ePub downloads, according to the available data) and Abstracts Views on Vision4Press platform.
Data correspond to usage on the plateform after 2015. The current usage metrics is available 48-96 hours after online publication and is updated daily on week days.
Initial download of the metrics may take a while.