Open Access
Fig. 6.
Download original image
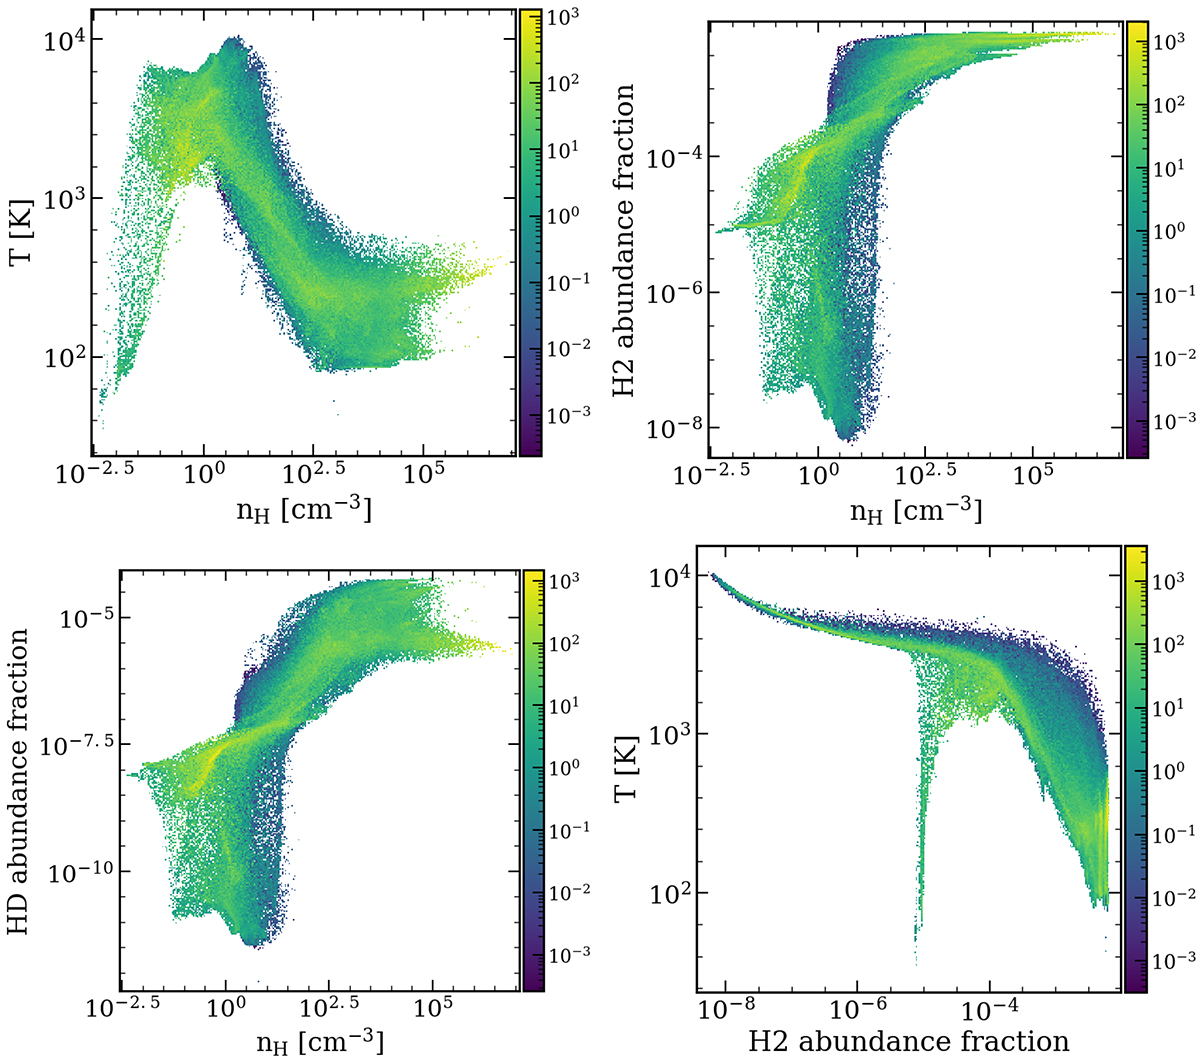
Phase diagrams of the gas within the virial radius of the halo of Fig. 5. We show the temperature, H2 fraction, and HD fraction versus the gas density and the temperature versus the H2 fraction. The logarighmic colormap is weighted with the mass of the gas within each bin.
Current usage metrics show cumulative count of Article Views (full-text article views including HTML views, PDF and ePub downloads, according to the available data) and Abstracts Views on Vision4Press platform.
Data correspond to usage on the plateform after 2015. The current usage metrics is available 48-96 hours after online publication and is updated daily on week days.
Initial download of the metrics may take a while.