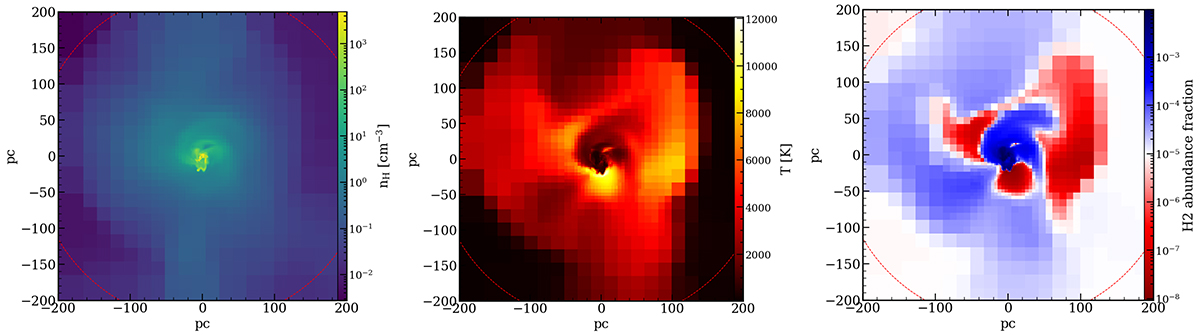
Fig. 5.
Download original image
Maps of a halo at z = 18 of mass Mvir = 3 × 10⁶ M⊙ and Tvir = 5.7 × 10³ K. The first map shows the gas density, the middle one the gas temperature and the rightmost one a map of H2 mass fraction. Every property is computed from a mass-average in a slice 30 pc deep. The red circle is the virial radius of the halo. The density map shows the gas collapsing from larger scale, channeling along filaments into the halo. At roughly the virial radius, the gas is heated and starts to pile up. Then, as molecule formation is triggered, gas starts to cool down. Despite the much higher density in the centre of the halo of ∼105 cm−3, the gas is much colder, reaching a few hundred K. Here, in the densest region, the H2 mass fraction reaches ∼10−3. The gas temperature correlates strongly with the H2 fraction, revealing the importance of H2 for cooling.
Current usage metrics show cumulative count of Article Views (full-text article views including HTML views, PDF and ePub downloads, according to the available data) and Abstracts Views on Vision4Press platform.
Data correspond to usage on the plateform after 2015. The current usage metrics is available 48-96 hours after online publication and is updated daily on week days.
Initial download of the metrics may take a while.