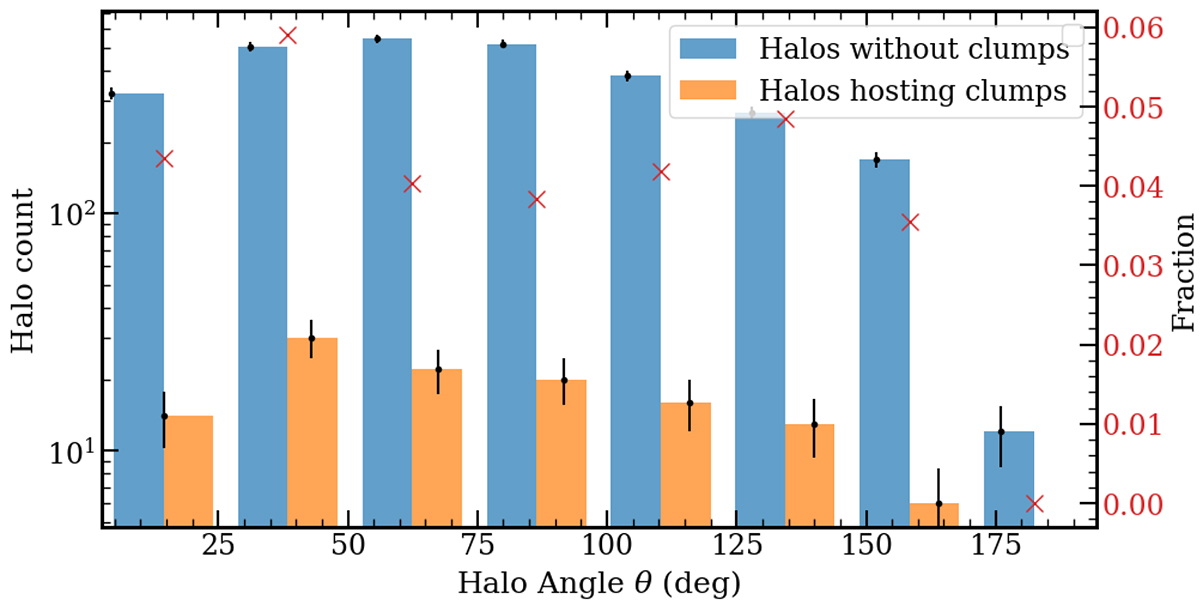
Fig. 14.
Download original image
Histogram of the probability density of the angle θ between the DM and baryonic angular momentum vectors for halos without clumps (blue bars) and halos hosting clumps (red bars) for the three last snapshots (corresponding to redshifts 19.5, 18.8 and 18). Error bars correspond to the Poissonian error. The fraction on the right-axis corresponds to the ratio of the number of halos hosting a clump versus the total number of halos.
Current usage metrics show cumulative count of Article Views (full-text article views including HTML views, PDF and ePub downloads, according to the available data) and Abstracts Views on Vision4Press platform.
Data correspond to usage on the plateform after 2015. The current usage metrics is available 48-96 hours after online publication and is updated daily on week days.
Initial download of the metrics may take a while.