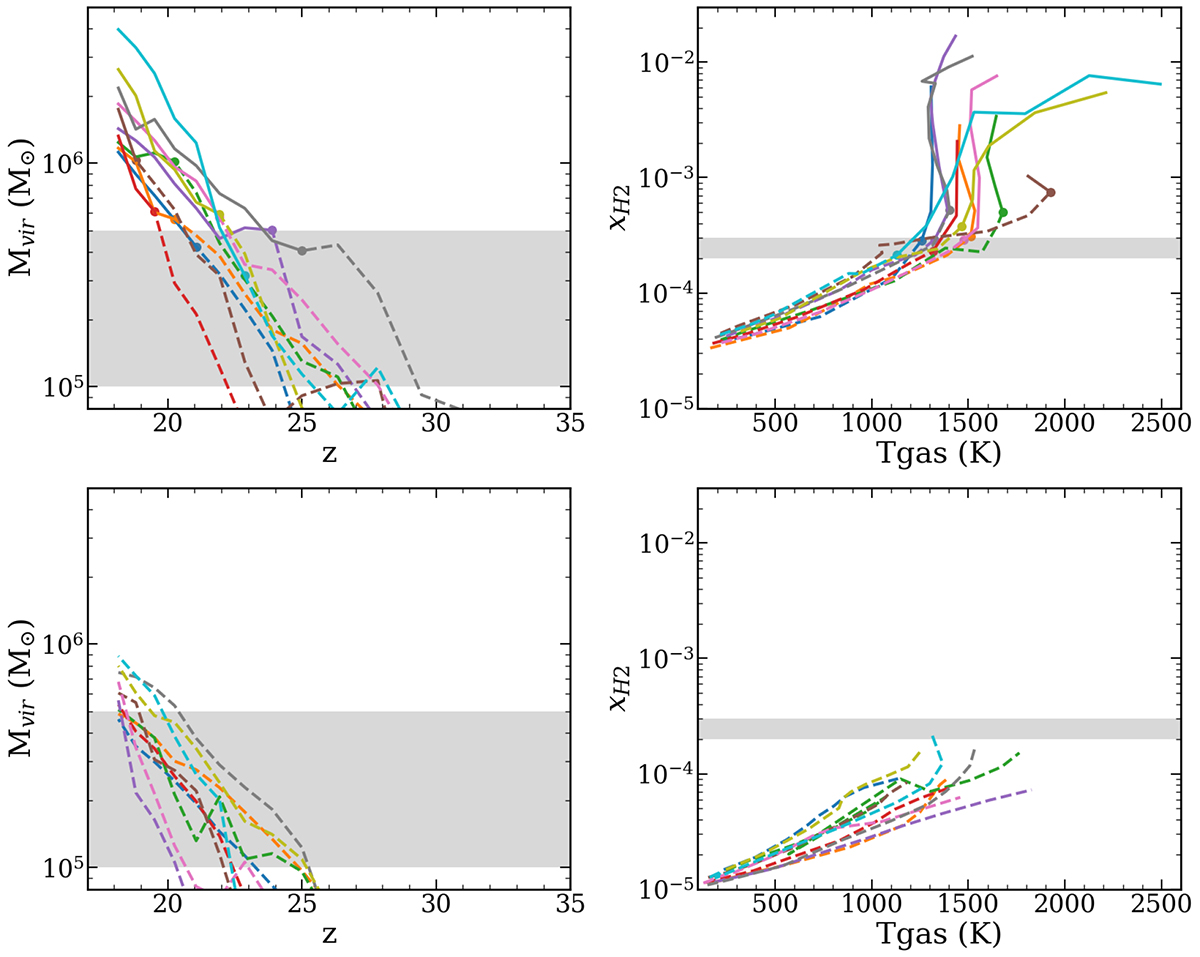
Fig. 11.
Download original image
Evolution of halos across snapshots. Top: sample of halos hosting clump at z = 18.8, left: halo virial mass vs redshift, right: halo H2 abundance vs mass average gas temperature. The boundary between the solid line and dashed line corresponds to the snapshot at which a halo first host a cold gas clump. Bottom: same plot for a sample of halos that do not host cold gas clump. The gray rectangle shows the interval in the crirical value of Mvir and xH2 identified in Sect. 3.4.
Current usage metrics show cumulative count of Article Views (full-text article views including HTML views, PDF and ePub downloads, according to the available data) and Abstracts Views on Vision4Press platform.
Data correspond to usage on the plateform after 2015. The current usage metrics is available 48-96 hours after online publication and is updated daily on week days.
Initial download of the metrics may take a while.