Open Access
Fig. 9.
Download original image
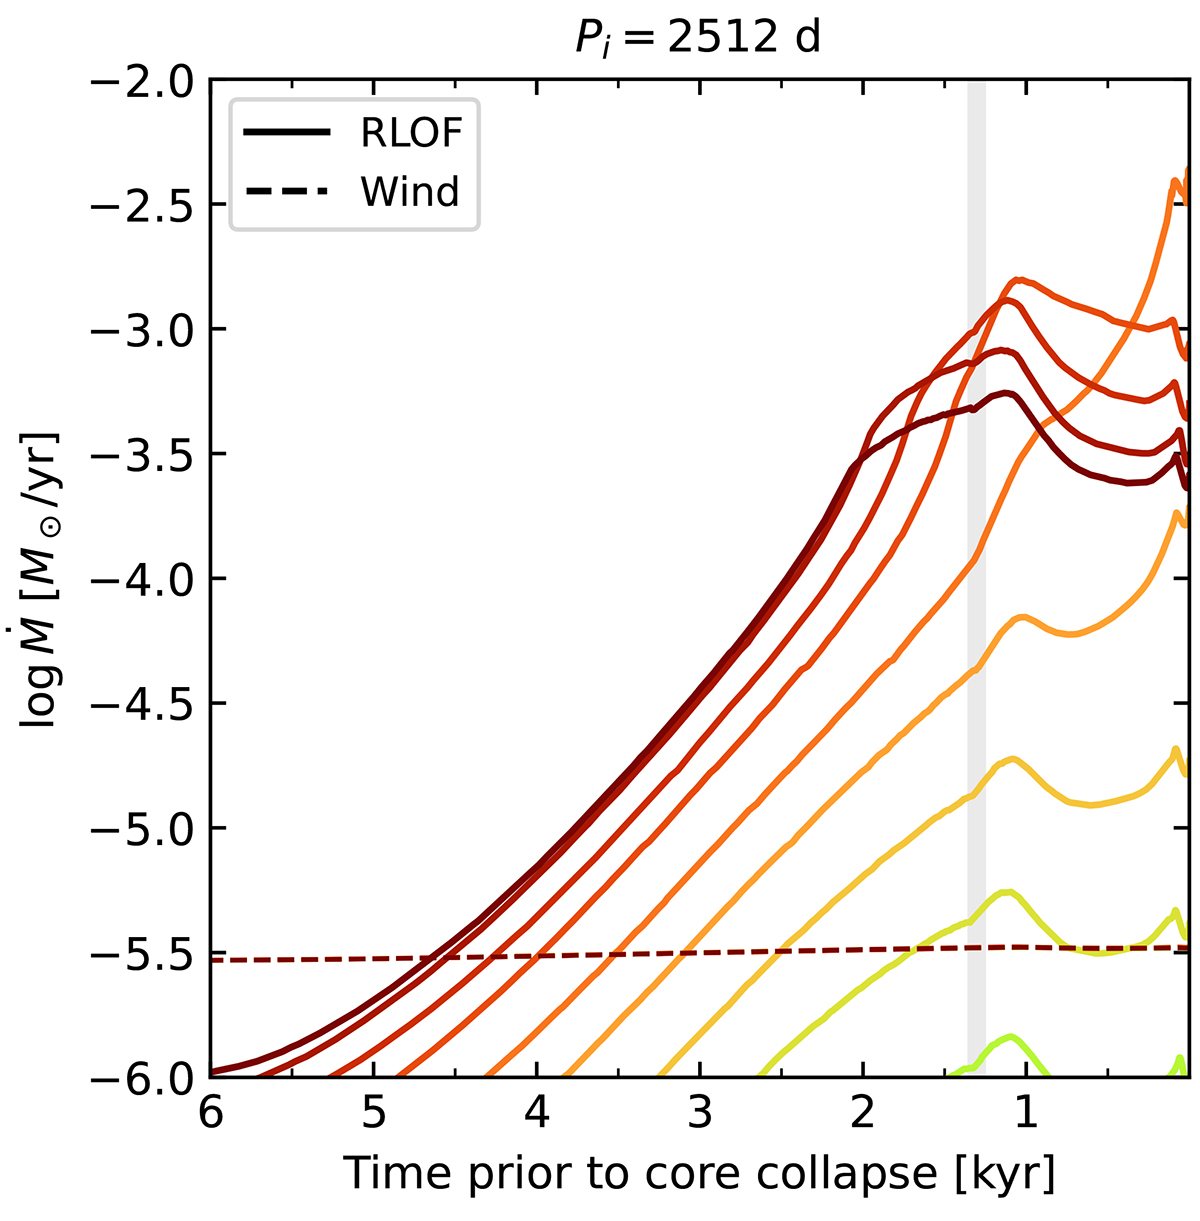
Mass-loss rate as a function of time prior to collapse for the models with Pi = 2412 d, with different qi shown in different colors as in Fig. 8. The vertical gray bar highlights the moment of core carbon depletion.
Current usage metrics show cumulative count of Article Views (full-text article views including HTML views, PDF and ePub downloads, according to the available data) and Abstracts Views on Vision4Press platform.
Data correspond to usage on the plateform after 2015. The current usage metrics is available 48-96 hours after online publication and is updated daily on week days.
Initial download of the metrics may take a while.