Fig. 8.
Download original image
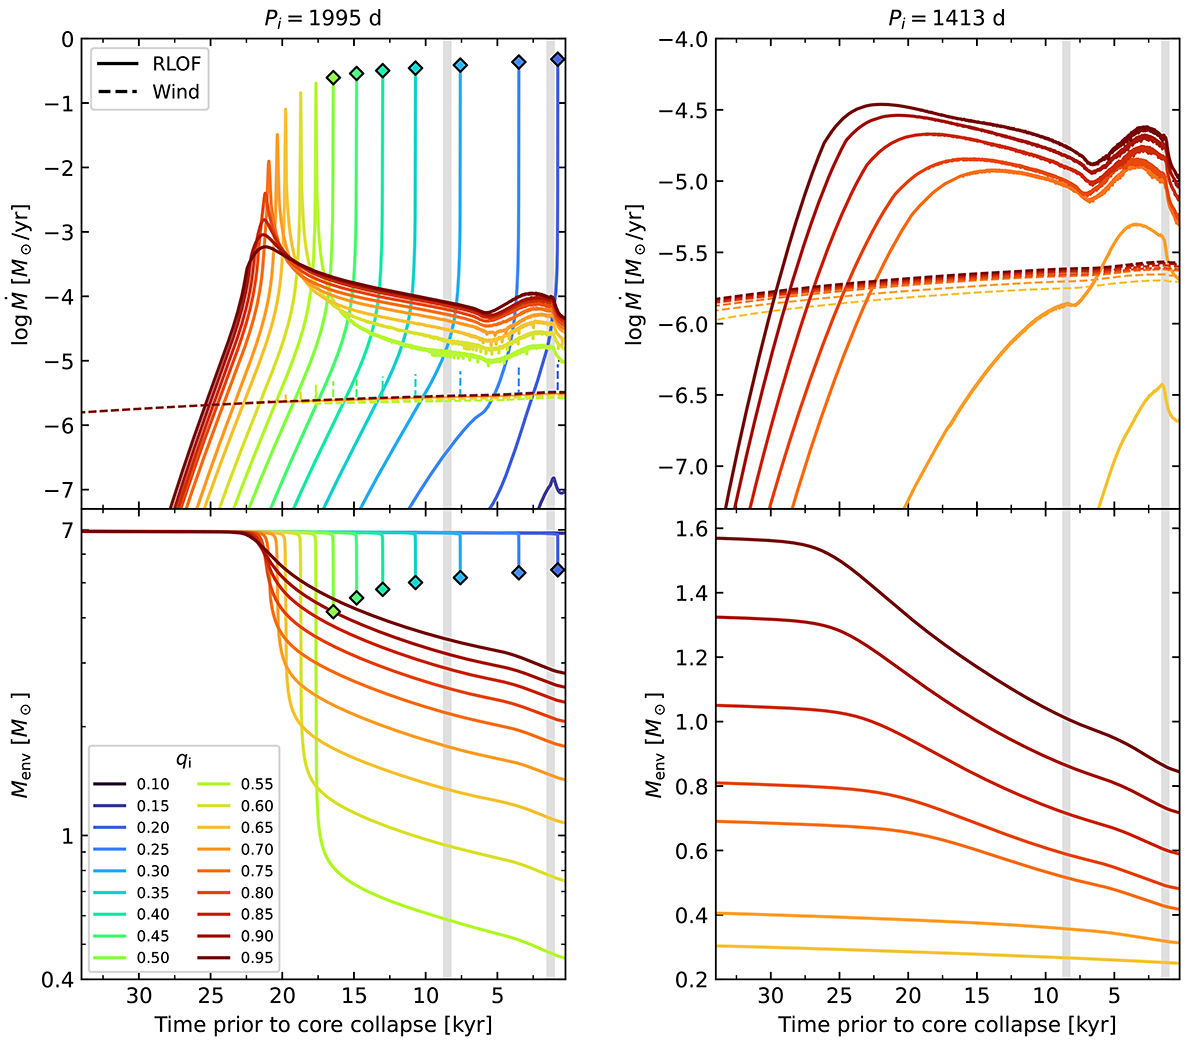
Mass-loss rate (top) and envelope mass (bottom) as a function of time prior to collapse in the models with Pi = 1995 d (left) and Pi = 1413 d (right), and with different qi shown in different colors (see legend). The vertical gray bars highlight, from left to right, the moment of ignition and depletion of carbon in the core. The markers represent the start of unstable mass transfer. Model C1413−0.10 is not shown, but its behavior is similar to Model C1995−0.20.
Current usage metrics show cumulative count of Article Views (full-text article views including HTML views, PDF and ePub downloads, according to the available data) and Abstracts Views on Vision4Press platform.
Data correspond to usage on the plateform after 2015. The current usage metrics is available 48-96 hours after online publication and is updated daily on week days.
Initial download of the metrics may take a while.