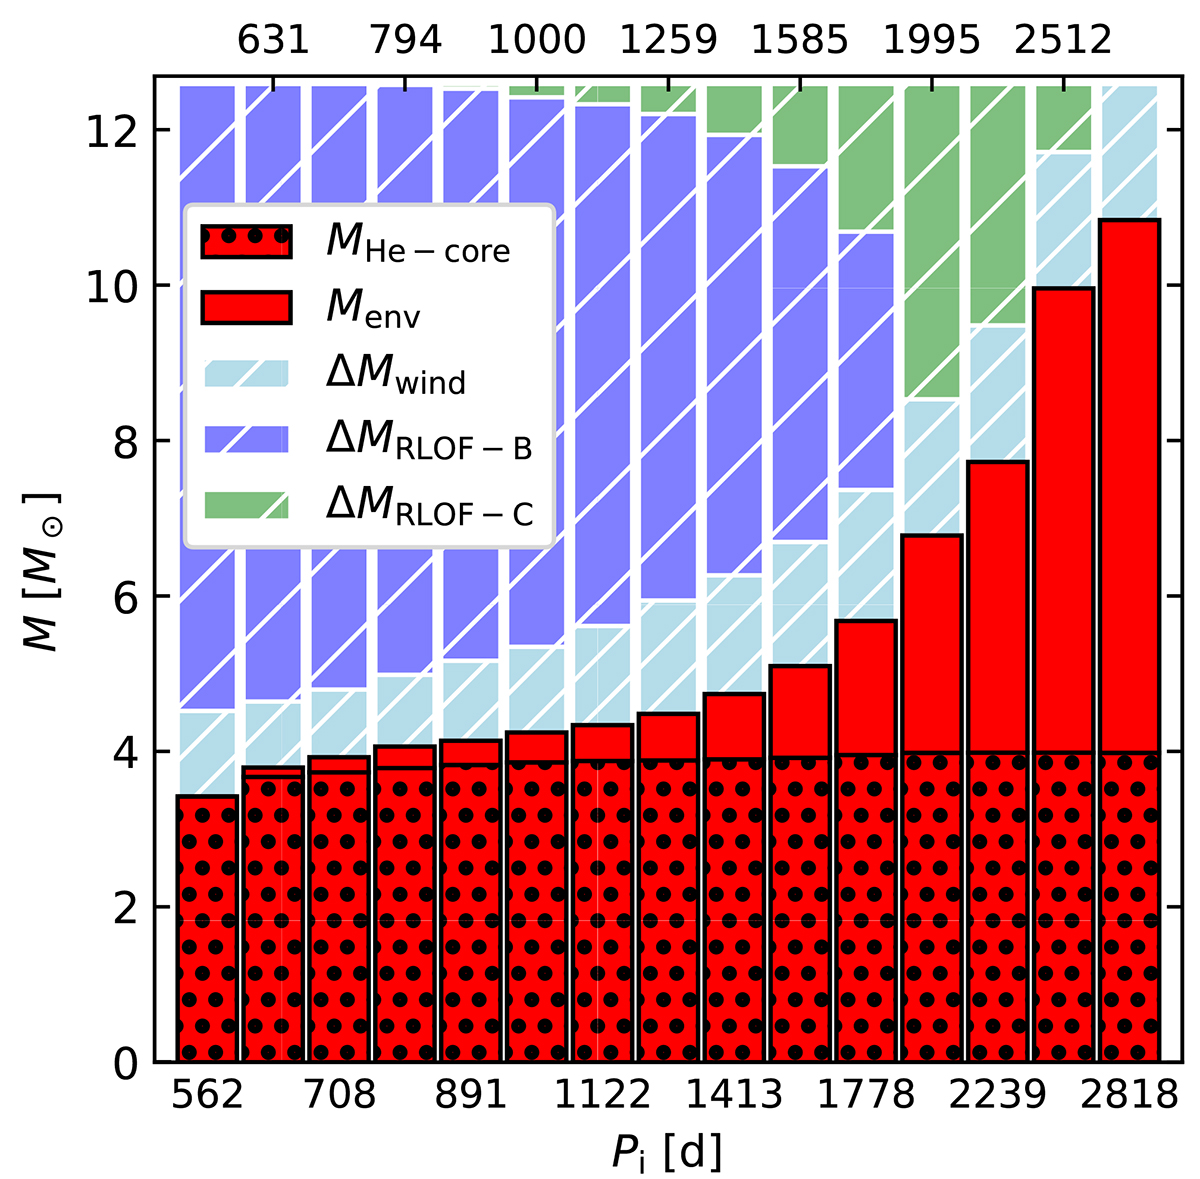
Fig. 7.
Download original image
Stacked-bar chart showing how much of the primary star’s initial mass of 12.6 M⊙ is left at core collapse (red), and how much is lost (white hatching), as a function of the initial binary orbital period for our systems with an initial mass ratio of qi = 0.95. The helium core mass (red filling, black dots) is distinguished from the mass of the remaining H-rich envelope (red filling, no hatching) with a black line. The three colored white-hatched bars represent the mass lost via wind (azure), Case B RLOF (blue), and Case C RLOF (green).
Current usage metrics show cumulative count of Article Views (full-text article views including HTML views, PDF and ePub downloads, according to the available data) and Abstracts Views on Vision4Press platform.
Data correspond to usage on the plateform after 2015. The current usage metrics is available 48-96 hours after online publication and is updated daily on week days.
Initial download of the metrics may take a while.