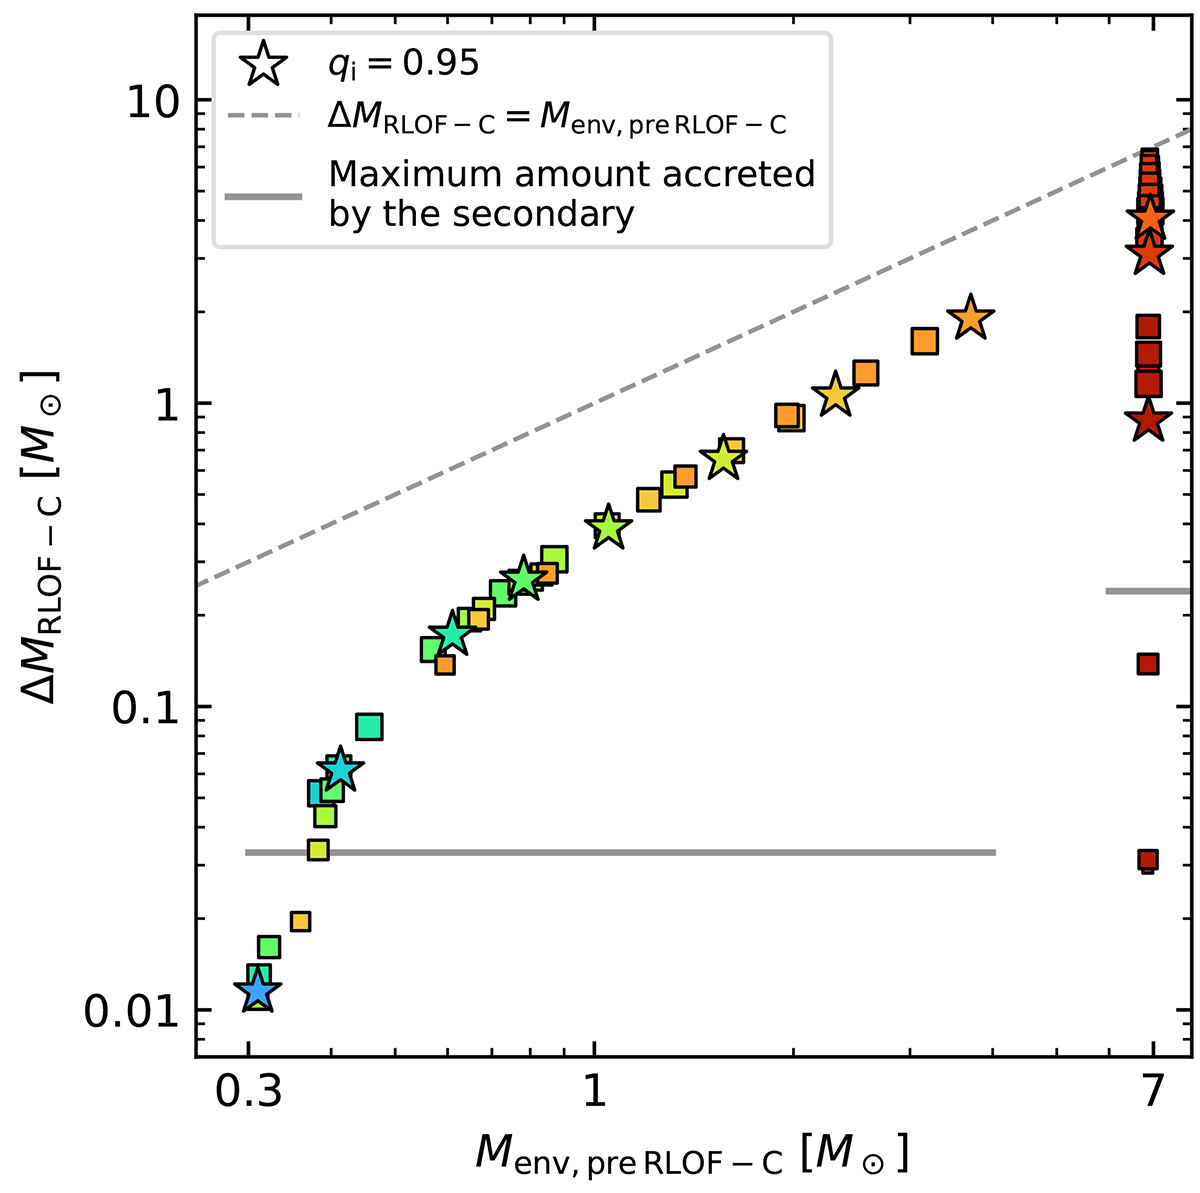
Fig. 5.
Download original image
Amount of mass lost by the primary star during stable Case C mass transfer as a function of the envelope mass prior to Case C RLOF. Models with different initial orbital periods are shown in different colors, as in Fig. 2. Models with qi = 0.95 are marked with a star, and models with smaller initial mass ratios are shown with smaller square markers. The gray horizontal lines mark the maximum mass that the secondaries accrete during the first (right) or second (left) phase of mass transfer.
Current usage metrics show cumulative count of Article Views (full-text article views including HTML views, PDF and ePub downloads, according to the available data) and Abstracts Views on Vision4Press platform.
Data correspond to usage on the plateform after 2015. The current usage metrics is available 48-96 hours after online publication and is updated daily on week days.
Initial download of the metrics may take a while.