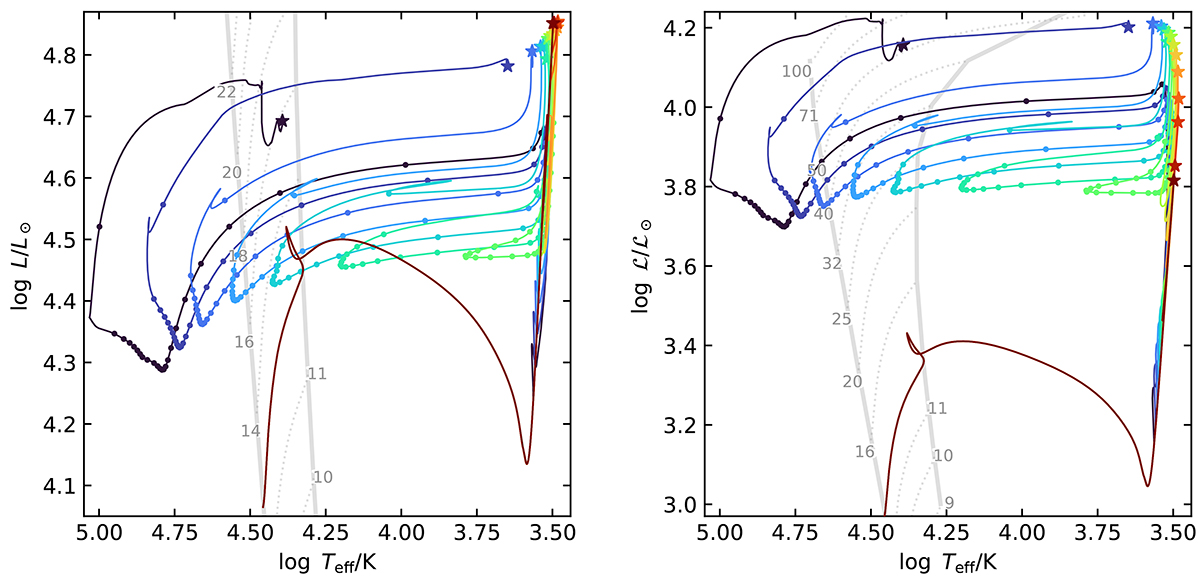
Fig. 4.
Download original image
Evolution of the primary stars for our models with qi = 0.95 in the HRD (left) and sHRD (right). The markers indicate the position where the primaries reach core collapse, and the color-coding is as in Fig. 2. Thick gray lines reflect the ZAMS and terminal-age main-sequence (TAMS) positions of single stars, and thin gray dashed lines show the main-sequence evolution of single stars with initial mass displayed at the edges of the tracks. For models that leave the RSG regime after core helium ignition, dots are placed on their tracks at a fixed time interval of 50 kyr.
Current usage metrics show cumulative count of Article Views (full-text article views including HTML views, PDF and ePub downloads, according to the available data) and Abstracts Views on Vision4Press platform.
Data correspond to usage on the plateform after 2015. The current usage metrics is available 48-96 hours after online publication and is updated daily on week days.
Initial download of the metrics may take a while.