Fig. 2.
Download original image
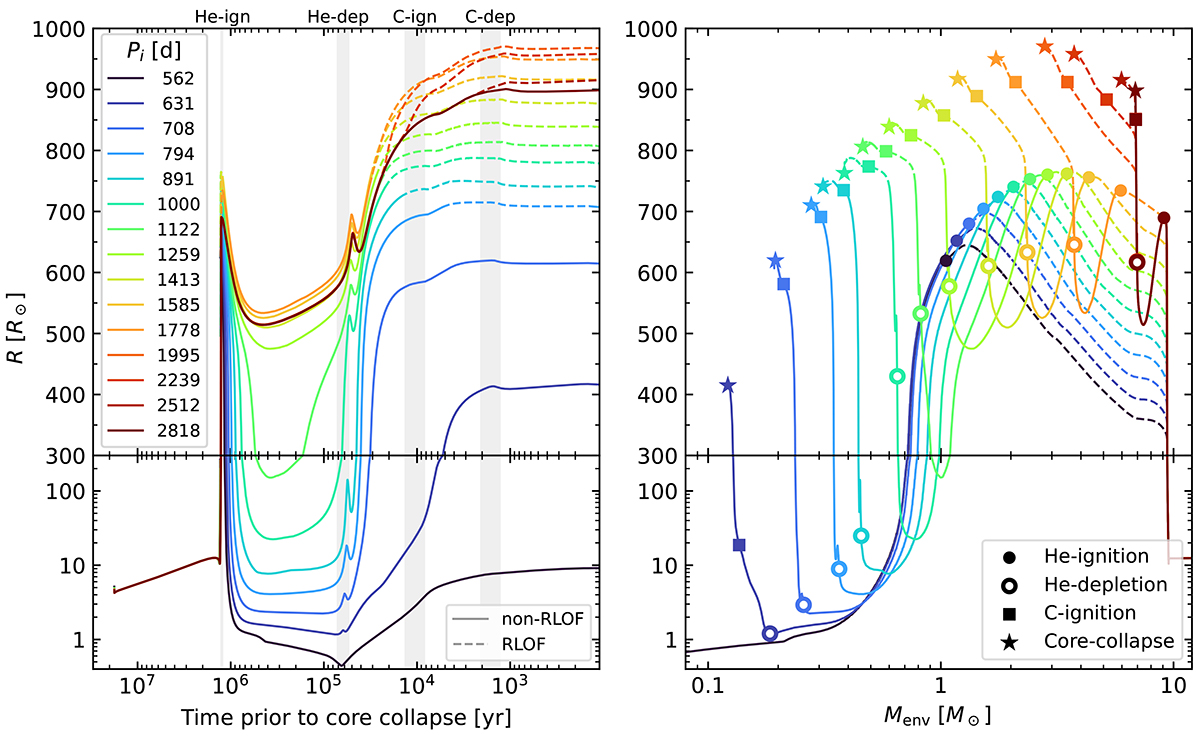
Evolution of the radius as a function of the time left until core collapse (left) and as a function of the evolving envelope mass (right) of the primary star in models with qi = 0.95. Each plot is divided into two parts, with a linear ordinate scale (top) and a logarithmic ordinate scale (bottom). The color coding reflects the initial orbital periods, where dashed lines correspond to phases of RLOF. Key evolutionary phases are also highlighted by gray vertical bars (left) or markers (right), indicating respectively when core He and C are ignited (-ign) and depleted (-dep).
Current usage metrics show cumulative count of Article Views (full-text article views including HTML views, PDF and ePub downloads, according to the available data) and Abstracts Views on Vision4Press platform.
Data correspond to usage on the plateform after 2015. The current usage metrics is available 48-96 hours after online publication and is updated daily on week days.
Initial download of the metrics may take a while.