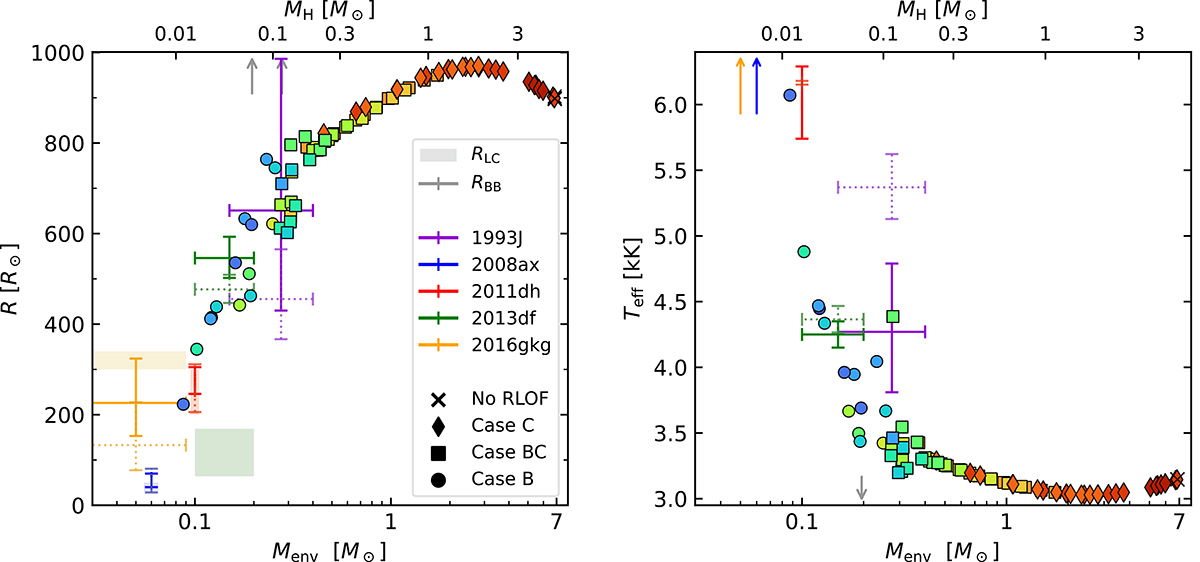
Fig. 11.
Download original image
Radius (left) and effective temperature (right) of the primary stars at core collapse as a function of their envelope mass, for models that undergo stable mass transfer and that are not fully stripped (filled markers). Different colors are defined as in Fig. 2, and different symbols indicate their mass transfer history (crosses for models not undergoing mass transfer, diamonds for Case C models, squares for Case BC and circles for Case B). Grey arrows indicate models with values outside of the bounds of the plot. The total mass of hydrogen in the models is displayed as a secondary axis on top. Estimated progenitor properties of several observed Type IIb SNe are also shown (cf. Table 2) with error bars. Solid-line error bars refer to several references (see Table 2) while those in dotted lines are taken from Gilkis & Arcavi (2022). The progenitor radius estimates from light-curve fitting are shown as shaded boxes.
Current usage metrics show cumulative count of Article Views (full-text article views including HTML views, PDF and ePub downloads, according to the available data) and Abstracts Views on Vision4Press platform.
Data correspond to usage on the plateform after 2015. The current usage metrics is available 48-96 hours after online publication and is updated daily on week days.
Initial download of the metrics may take a while.