Fig. 10.
Download original image
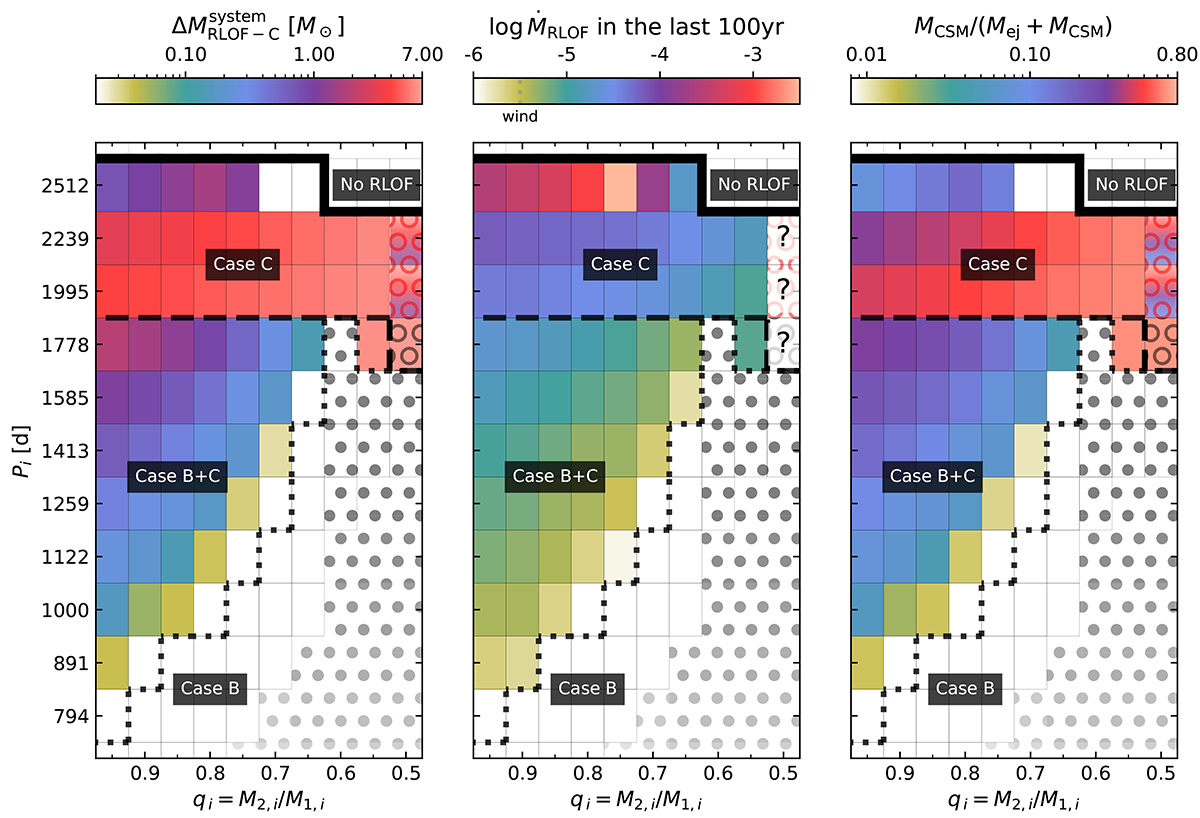
Pi − qi diagrams for our models as in Fig. 1, focusing on the models with qi ≥ 0.5, where the color-coding now denotes different properties. From left to right, they show the mass lost by the system (i.e., not accreted by the secondary) during Case C mass transfer (![]() ), the average mass-loss rate due to RLOF during the last 100 years prior to the end of the simulation (ṀRLOF), and the fraction of the SN kinetic energy that is expected to be converted into radiation by the interaction (MCSM/(Mej + MCSM), see Sect. 5.2). The hatching, as well as contour lines, are the same as in Fig. 1. Since the pre-SN envelope properties of the two longest-period Case C models with qi = 0.5 are rather unconstrained, we give the corresponding squares in the first and third panels a range of background colors indicating the range of possibilities. In the middle panel, we use a question mark for the three models which are expected to explode during or after a common envelope phase.
), the average mass-loss rate due to RLOF during the last 100 years prior to the end of the simulation (ṀRLOF), and the fraction of the SN kinetic energy that is expected to be converted into radiation by the interaction (MCSM/(Mej + MCSM), see Sect. 5.2). The hatching, as well as contour lines, are the same as in Fig. 1. Since the pre-SN envelope properties of the two longest-period Case C models with qi = 0.5 are rather unconstrained, we give the corresponding squares in the first and third panels a range of background colors indicating the range of possibilities. In the middle panel, we use a question mark for the three models which are expected to explode during or after a common envelope phase.
Current usage metrics show cumulative count of Article Views (full-text article views including HTML views, PDF and ePub downloads, according to the available data) and Abstracts Views on Vision4Press platform.
Data correspond to usage on the plateform after 2015. The current usage metrics is available 48-96 hours after online publication and is updated daily on week days.
Initial download of the metrics may take a while.