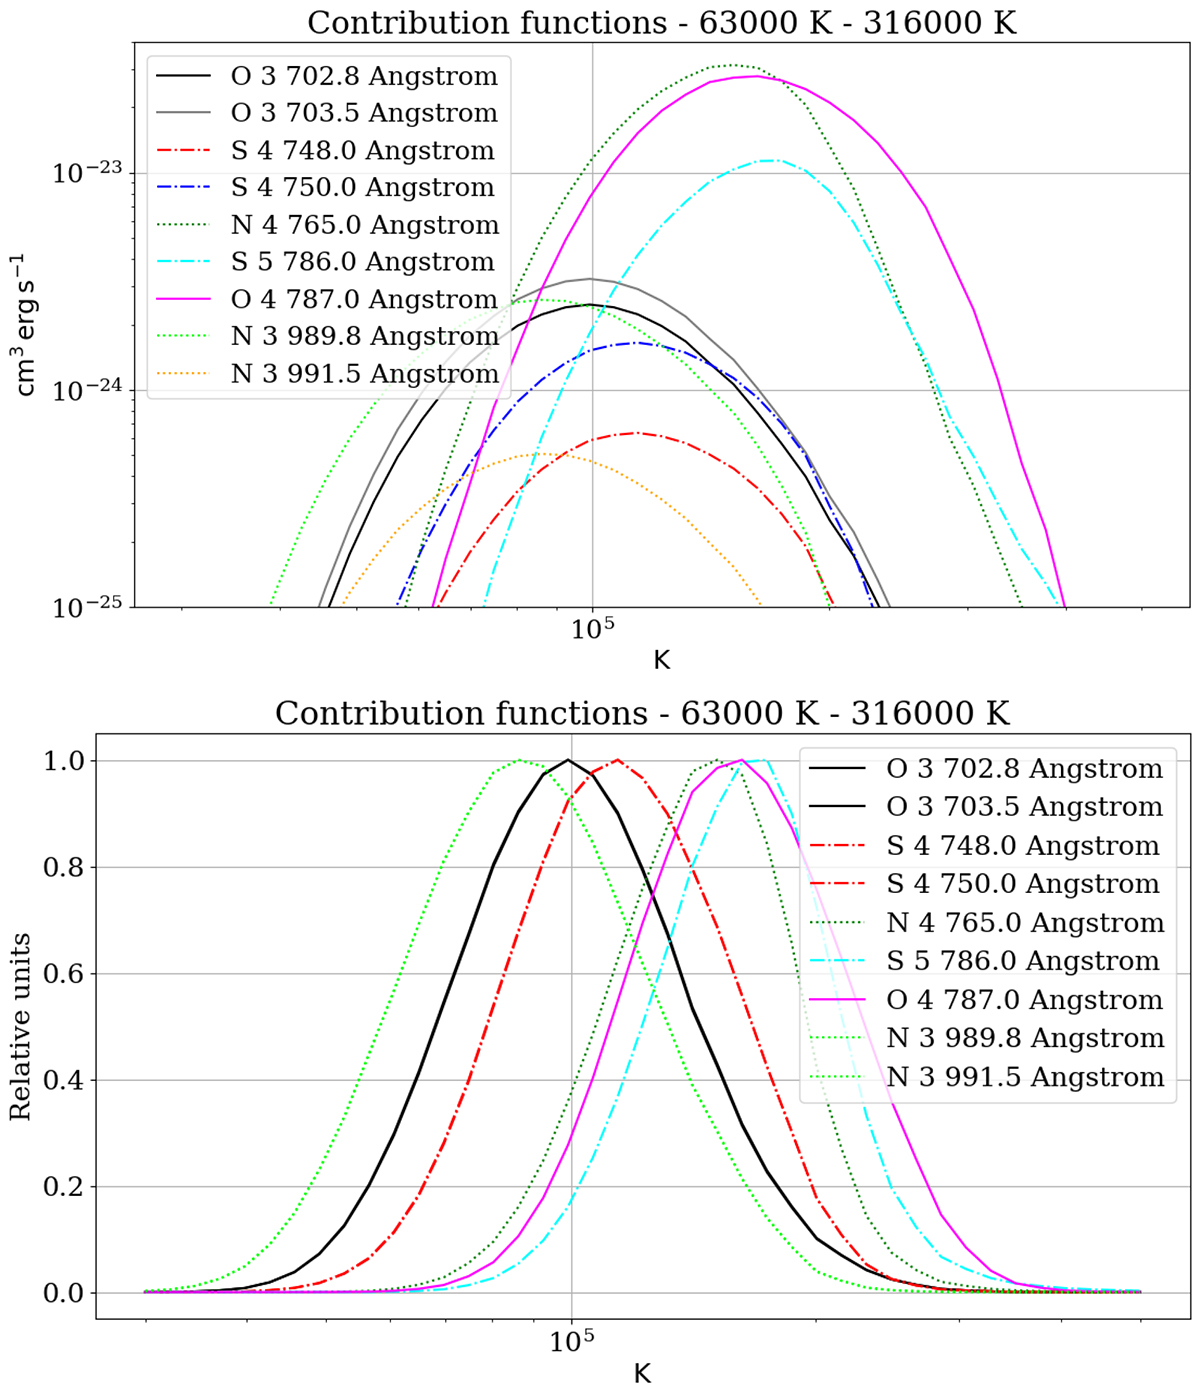
Fig. B.1.
Download original image
Contribution functions for lower-temperature lines - 6.3 × 10⁴ - 3.16 × 10⁵ K. Dotted lines represent the nitrogen contribution functions and dash-dotted ones the sulfur lines. Top: Contribution functions displayed on a log-log scale. Bottom: Contribution functions normalized and displayed on a linear y scale. Lines overlapping in temperature have been plotted in the same color for less confusion.
Current usage metrics show cumulative count of Article Views (full-text article views including HTML views, PDF and ePub downloads, according to the available data) and Abstracts Views on Vision4Press platform.
Data correspond to usage on the plateform after 2015. The current usage metrics is available 48-96 hours after online publication and is updated daily on week days.
Initial download of the metrics may take a while.