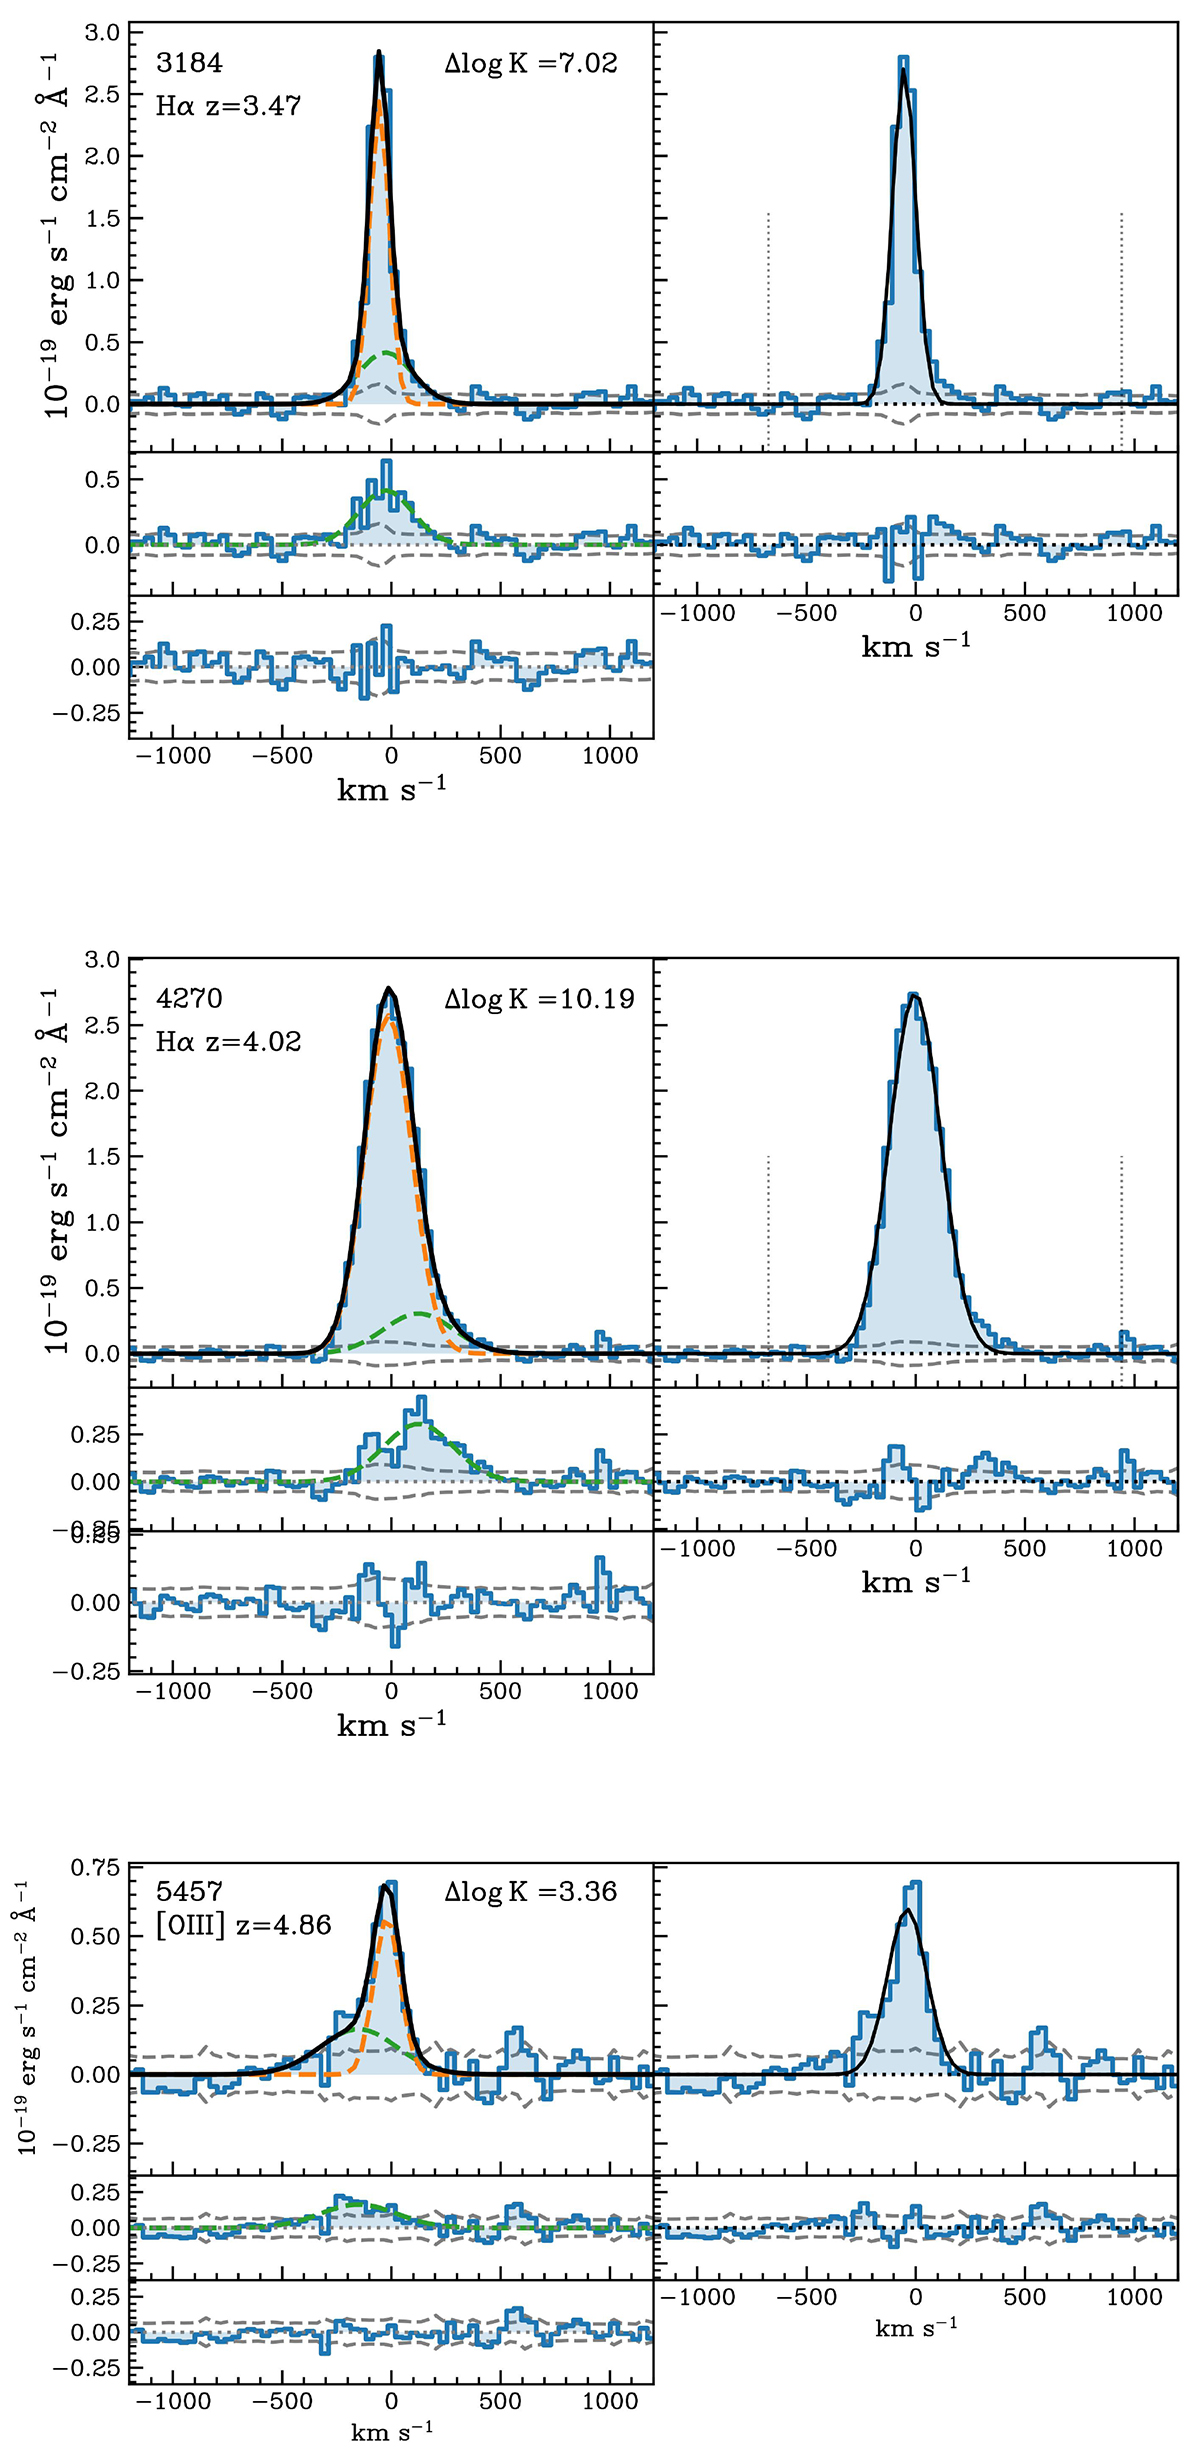
Fig. A.2.
Download original image
Rest-frame optical emission line profiles of the targets showing outflow features. For each target, the top left and right panels show the two- and single-Gaussian best-fit models in black, respectively. The text in the left panel reports the ID of the target, its redshift, the name of the rest-frame optical emission line, and the difference between the logarithmic Bayesian evidence (Δlog K) of the two models. The second panel from the top reports the residuals from the subtraction of the core component (the orange line in the top left panel and the black line in the top right panel). The third panel from the top illustrates the residuals from the double-Gaussian component fitting. The ±1σ rms of the spectra is indicated by dashed grey lines.
Current usage metrics show cumulative count of Article Views (full-text article views including HTML views, PDF and ePub downloads, according to the available data) and Abstracts Views on Vision4Press platform.
Data correspond to usage on the plateform after 2015. The current usage metrics is available 48-96 hours after online publication and is updated daily on week days.
Initial download of the metrics may take a while.