Fig. 7.
Download original image
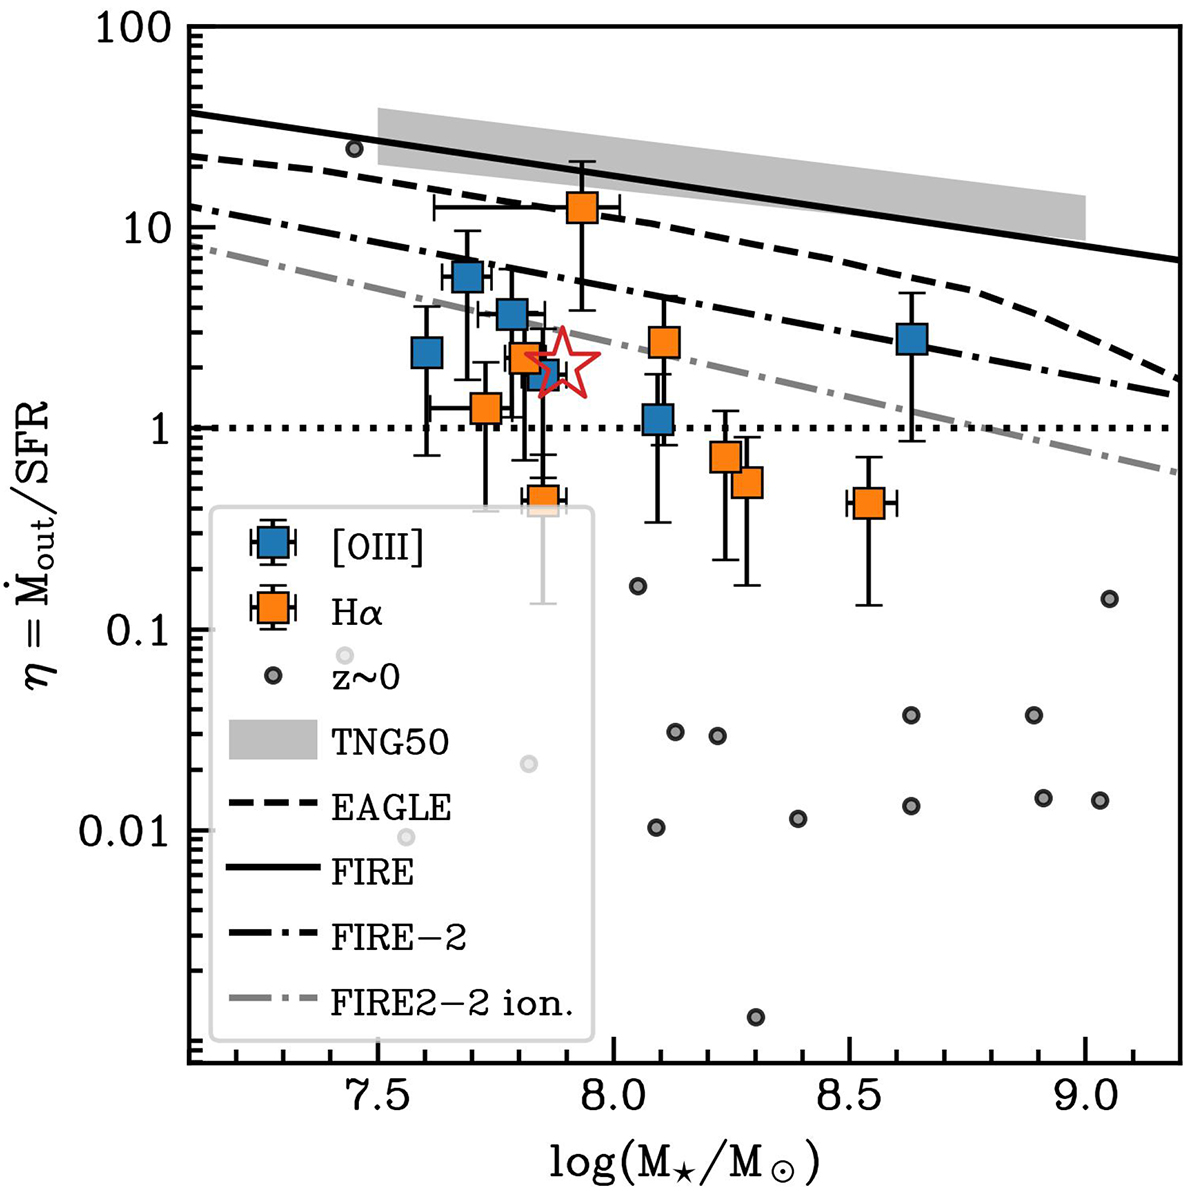
Stellar mass dependence of the outflow mass-loading factor (i.e. the ratio of the mass-loss rate and SFR). Estimates based on [O III] and Hα emission lines are reported as blue and orange squares, respectively. The median outflow mass-loading factor is illustrated as a red star. The grey circles show the mass-loading factors from a sample of dwarf galaxies at z ∼ 0 (Marasco et al. 2023). The shaded grey region shows the prediction from the TNG50 simulations at z ∼ 5 (Nelson et al. 2019), and the solid and dashed black lines are the trend at z ∼ 5 from EAGLE (Mitchell et al. 2020) and the redshift-independent relation from FIRE simulations (Muratov et al. 2015), respectively. The dot-dashed black and grey lines show the prediction from the FIRE-2 simulation for all outflow phases combined and for the ionised outflow alone, respectively (Pandya et al. 2021).
Current usage metrics show cumulative count of Article Views (full-text article views including HTML views, PDF and ePub downloads, according to the available data) and Abstracts Views on Vision4Press platform.
Data correspond to usage on the plateform after 2015. The current usage metrics is available 48-96 hours after online publication and is updated daily on week days.
Initial download of the metrics may take a while.