Fig. 5.
Download original image
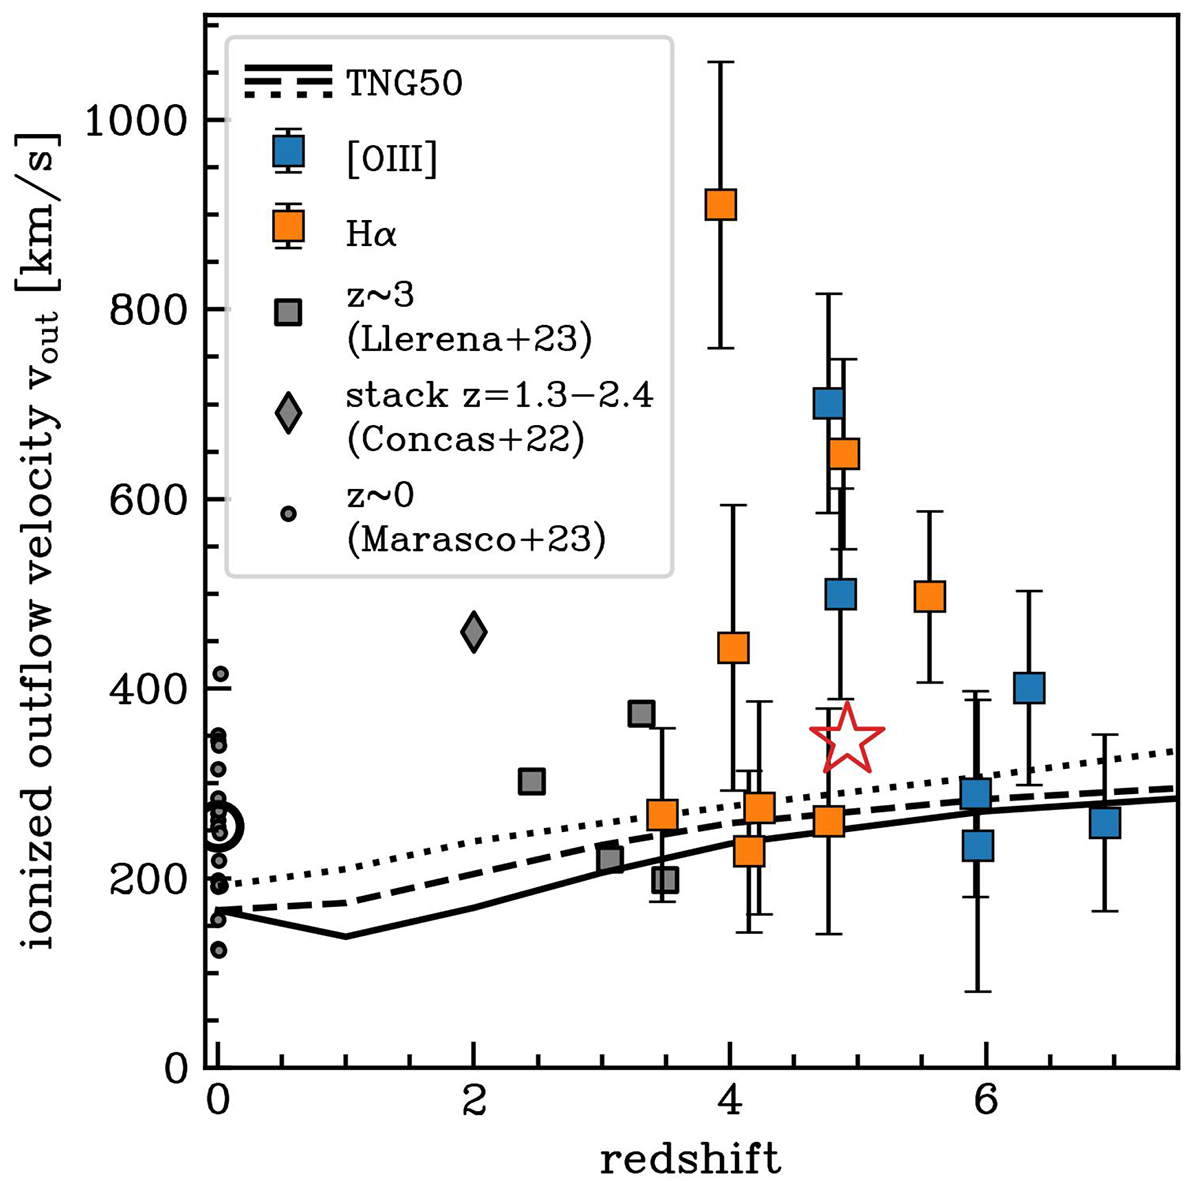
Cosmic evolution of ionised outflow velocities from rest-frame optical emission lines in low-mass (M⋆ < 109 M⊙) galaxies. The blue and orange squares indicate the outflows from JADES. The red star represents the median outflow velocity of our sample. The grey circles are the outflow velocities from a sample of local low-mass galaxies (Marasco et al. 2023) and re-estimated consistently with our definition (see details in the text). The larger empty circle is their median. The diamond shows a tentative outflow detection by stacking spectra of low-mass galaxies at z = 1.2 − 2.6 (Concas et al. 2022). The squares report the outflow velocities detected in four low-mass galaxies at z ∼ 3 (Llerena et al. 2023). The dotted, dashed, and solid black lines are the predictions from the TNG50 simulation for three different stellar masses: M⋆ = 108.5, 108, and 107.5 M⊙ (Nelson et al. 2019).
Current usage metrics show cumulative count of Article Views (full-text article views including HTML views, PDF and ePub downloads, according to the available data) and Abstracts Views on Vision4Press platform.
Data correspond to usage on the plateform after 2015. The current usage metrics is available 48-96 hours after online publication and is updated daily on week days.
Initial download of the metrics may take a while.