Fig. 2.
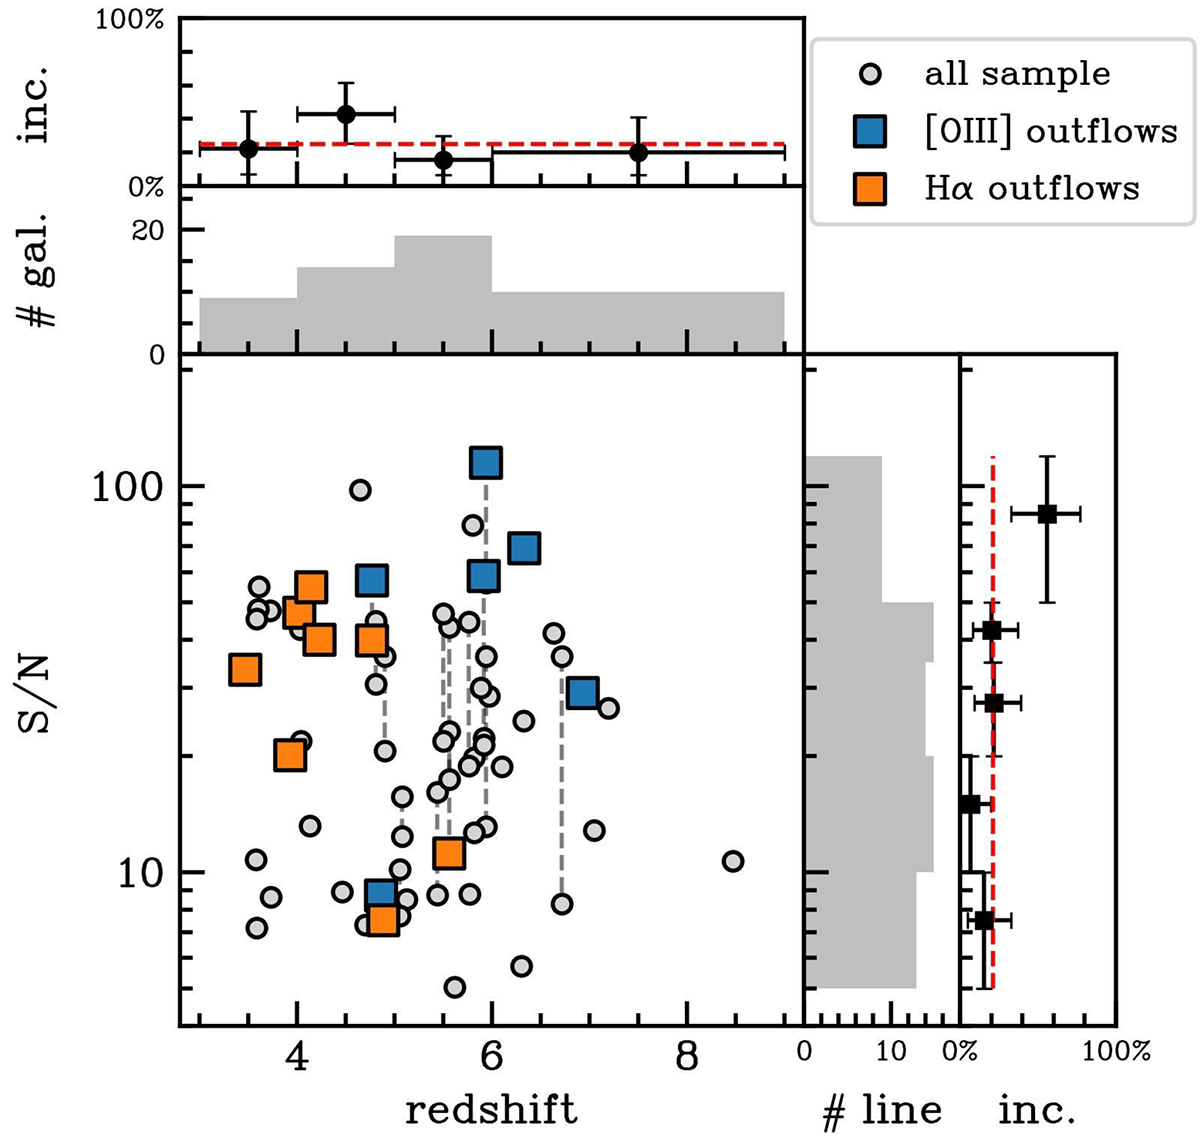
Download original image
S/N of the overall nebular line profiles as a function of redshift. All the detected lines in our sample are reported as grey circles, while the emission lines with evidence of the broad component are indicated with blue ([O III]) and orange (Hα) squares. The dashed grey lines indicate [O III] and Hα lines observed in the same galaxy. The top panels show the distribution of galaxies and the incidence of outflow in regular redshift bins. The right panels report the distribution of emission lines with S/N > 5 and the incidence of broad components in irregular bins of S/N, respectively. Each irregular bin of S/N contains a similar number of lines, except for the last bin at the highest S/N values. The dashed red line marks an incidence of 25%.
Current usage metrics show cumulative count of Article Views (full-text article views including HTML views, PDF and ePub downloads, according to the available data) and Abstracts Views on Vision4Press platform.
Data correspond to usage on the plateform after 2015. The current usage metrics is available 48-96 hours after online publication and is updated daily on week days.
Initial download of the metrics may take a while.