Open Access
Fig. A.2
Download original image
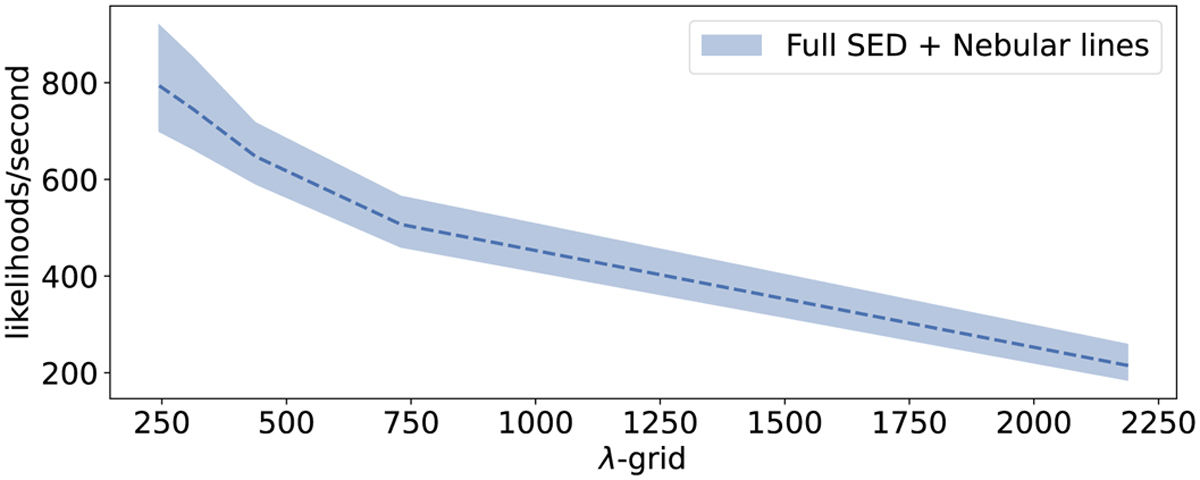
Likelihoods generated per second with GalaPy as a function of the wavelength grid resolution. The dashed line marks the average over 1000 measurements and the shaded region highlights the 1-σ confidence intervals.
Current usage metrics show cumulative count of Article Views (full-text article views including HTML views, PDF and ePub downloads, according to the available data) and Abstracts Views on Vision4Press platform.
Data correspond to usage on the plateform after 2015. The current usage metrics is available 48-96 hours after online publication and is updated daily on week days.
Initial download of the metrics may take a while.