Fig. 15
Download original image
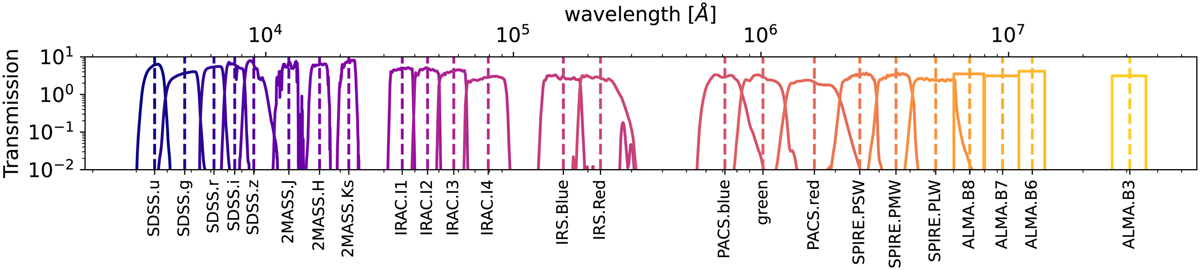
Photometric system used to generate the mock observation for the actively star-forming simulated galaxies of Sect. 4.1. The lower x-axis shows the keyword name of the band-pass transmission while the upper x-axis shows the corresponding wavelength in angstroms. Transmissions are expressed in terms of photons and the dashed lines mark the position of the pivot wavelength for each band-pass filter. We note that this is just a possible set-up specific to the case of the mock galaxy of Sect. 4.1. It represents only a sub-set of the band-pass transmissions available in the GalaPy database.
Current usage metrics show cumulative count of Article Views (full-text article views including HTML views, PDF and ePub downloads, according to the available data) and Abstracts Views on Vision4Press platform.
Data correspond to usage on the plateform after 2015. The current usage metrics is available 48-96 hours after online publication and is updated daily on week days.
Initial download of the metrics may take a while.