Fig. 5.
Download original image
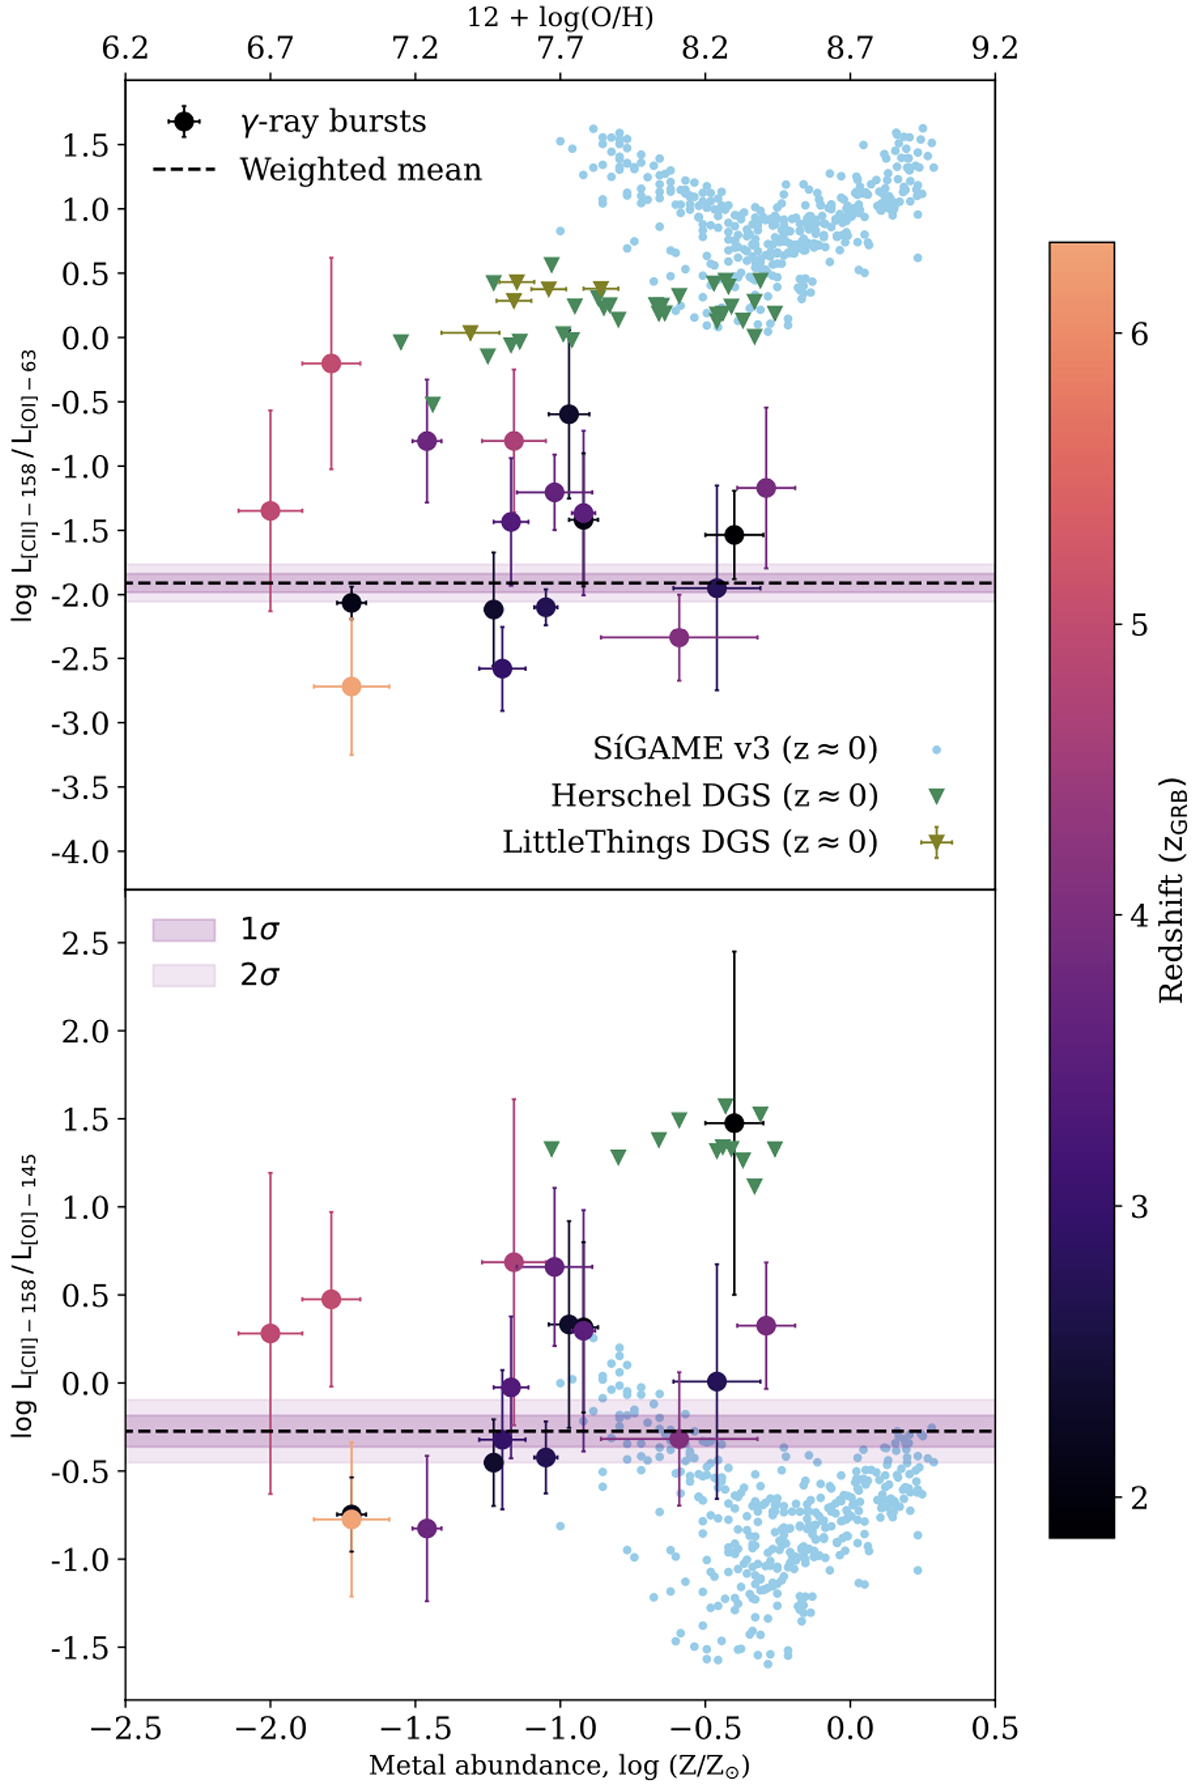
Absorption-derived [O I]63 μm-to-[C II]158 μm and [O I]145 μm-to-[C II]158 μm line luminosity ratios as a function of metallicity and redshift. The color and symbol notation follow Fig. 3. The black solid lines and the grey-shaded regions show the weighted means and the associated 1- and 2-sigma uncertainty of each line ratio. Similar to Fig. 4 the local samples are shown as upper limits and are in fine agreement with the absorption-derived line luminosity ratios for both transitions in the GRB observations. Similarly to the absorption-derived [O I]63 μm-to-H I conversion factor, the simulation suggests a systematical displacement in the absorption-derived [O I]63 μm-to-[C II]158 μm line luminosity.
Current usage metrics show cumulative count of Article Views (full-text article views including HTML views, PDF and ePub downloads, according to the available data) and Abstracts Views on Vision4Press platform.
Data correspond to usage on the plateform after 2015. The current usage metrics is available 48-96 hours after online publication and is updated daily on week days.
Initial download of the metrics may take a while.