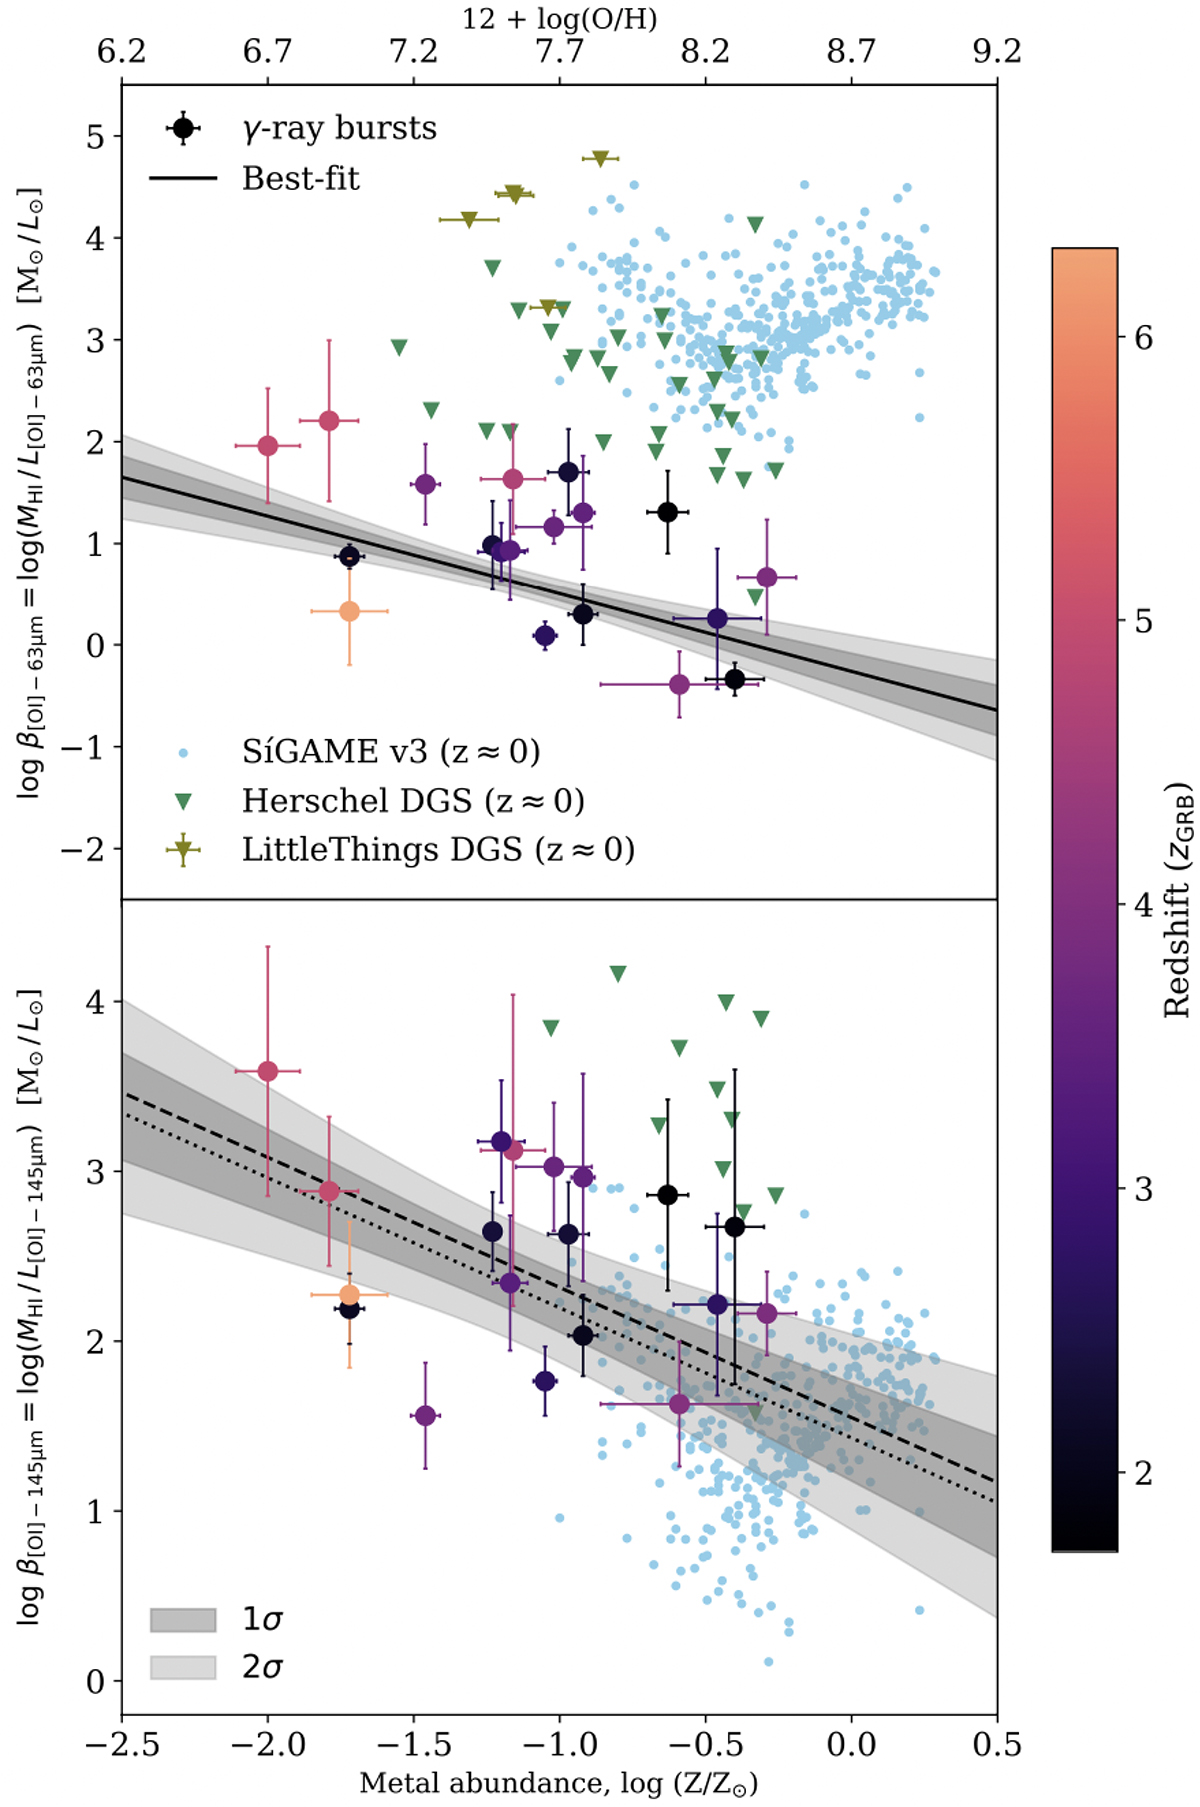
Fig. 4.
Download original image
Absorption-derived [O I]63 μm-to-H I (top panel) and [O I]145 μm-to-H I (bottom panel) conversion factors as a function of metallicity. The color and symbol notation follow Fig. 3. The black solid line and the grey-shaded region in the top panel represents the best fit linear relation and the associated uncertainty. The dotted line in the bottom panel shows the best fit of the intersection with the slope fixed at the value of the slope from the fit in the top panel. The dashed line consist of the fit from the top panel with the weighted mean added. The grey-shaded region includes the uncertainties associated with the fit from the top panel as well as the weighted mean. The local samples are shown as upper limits and are in fine agreement with the absorption-derived conversion factors for both transitions in the GRB observations. The simulation is in good agreement with the [O I]145 μm-to-H I conversion factor, while there seems to be a systematical displacement towards higher values for the [O I]63 μm-to-H I conversion factor.
Current usage metrics show cumulative count of Article Views (full-text article views including HTML views, PDF and ePub downloads, according to the available data) and Abstracts Views on Vision4Press platform.
Data correspond to usage on the plateform after 2015. The current usage metrics is available 48-96 hours after online publication and is updated daily on week days.
Initial download of the metrics may take a while.