Fig. 3.
Download original image
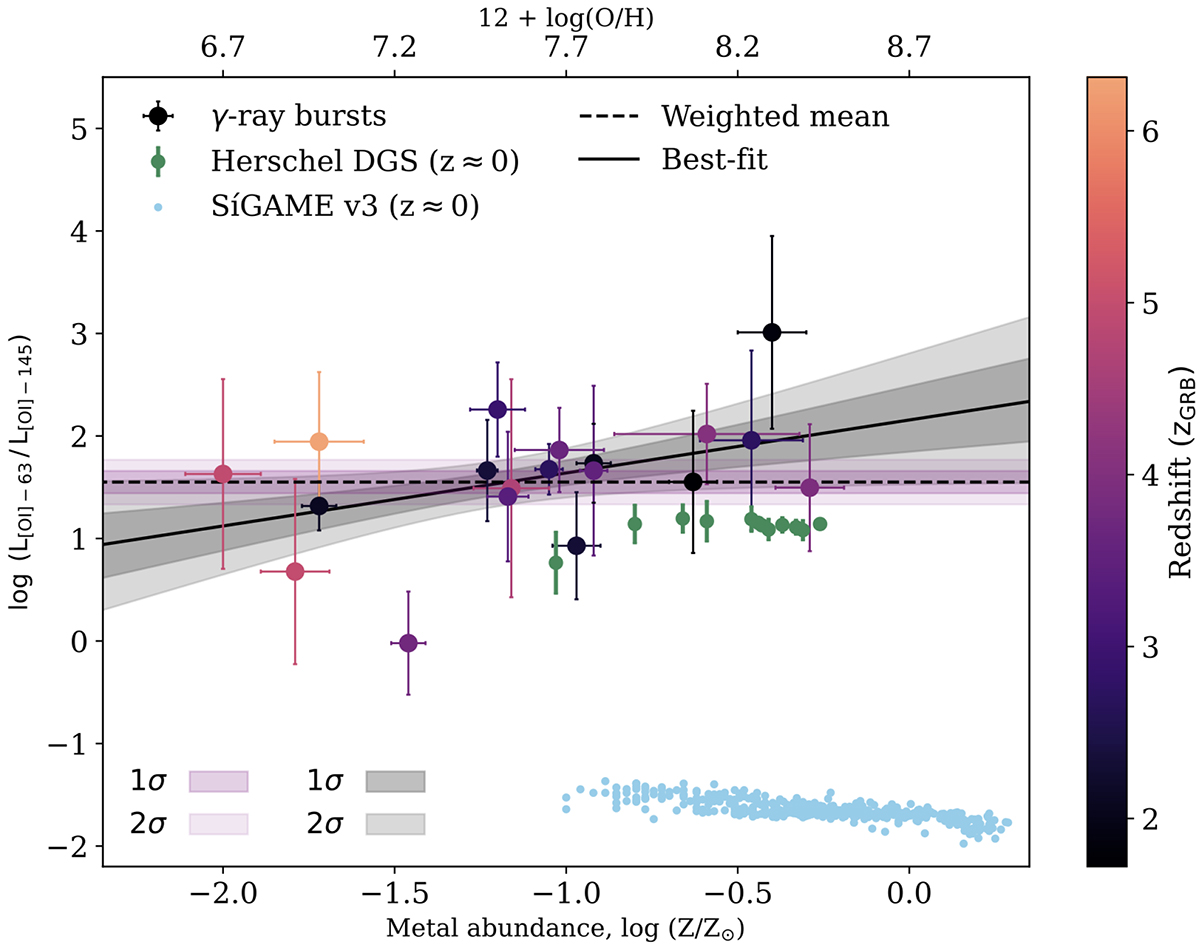
Luminosity ratio for the two selected transitions ([O I]−63 μm and [O I]−145 μm) in log-scale plotted against the metal abundance, log(Z/Z⊙). The black solid line and the grey-shaded regions show the weighted mean of log(L[OI]−63 μm/L[OI]−145 μm) = 1.55 ± 0.12 and the associated 1- and 2-sigma uncertainty. The purple dashed line and the purple-shaded regions show the best fit. The GRBs are color-coded as a function of redshift and are compared to direct measurements from the local z ≈ 0 Herschel Dwarf Galaxy Survey (Madden et al. 2013; Cormier et al. 2015) and to predictions from the SIGAME hydrodynamical simulations framework (Olsen et al. 2021). Overall, the local sample is in good agreement with the GRB observations, whereas the simulation shows a systematical displacement towards a lower luminosity ratio for the two transitions.
Current usage metrics show cumulative count of Article Views (full-text article views including HTML views, PDF and ePub downloads, according to the available data) and Abstracts Views on Vision4Press platform.
Data correspond to usage on the plateform after 2015. The current usage metrics is available 48-96 hours after online publication and is updated daily on week days.
Initial download of the metrics may take a while.