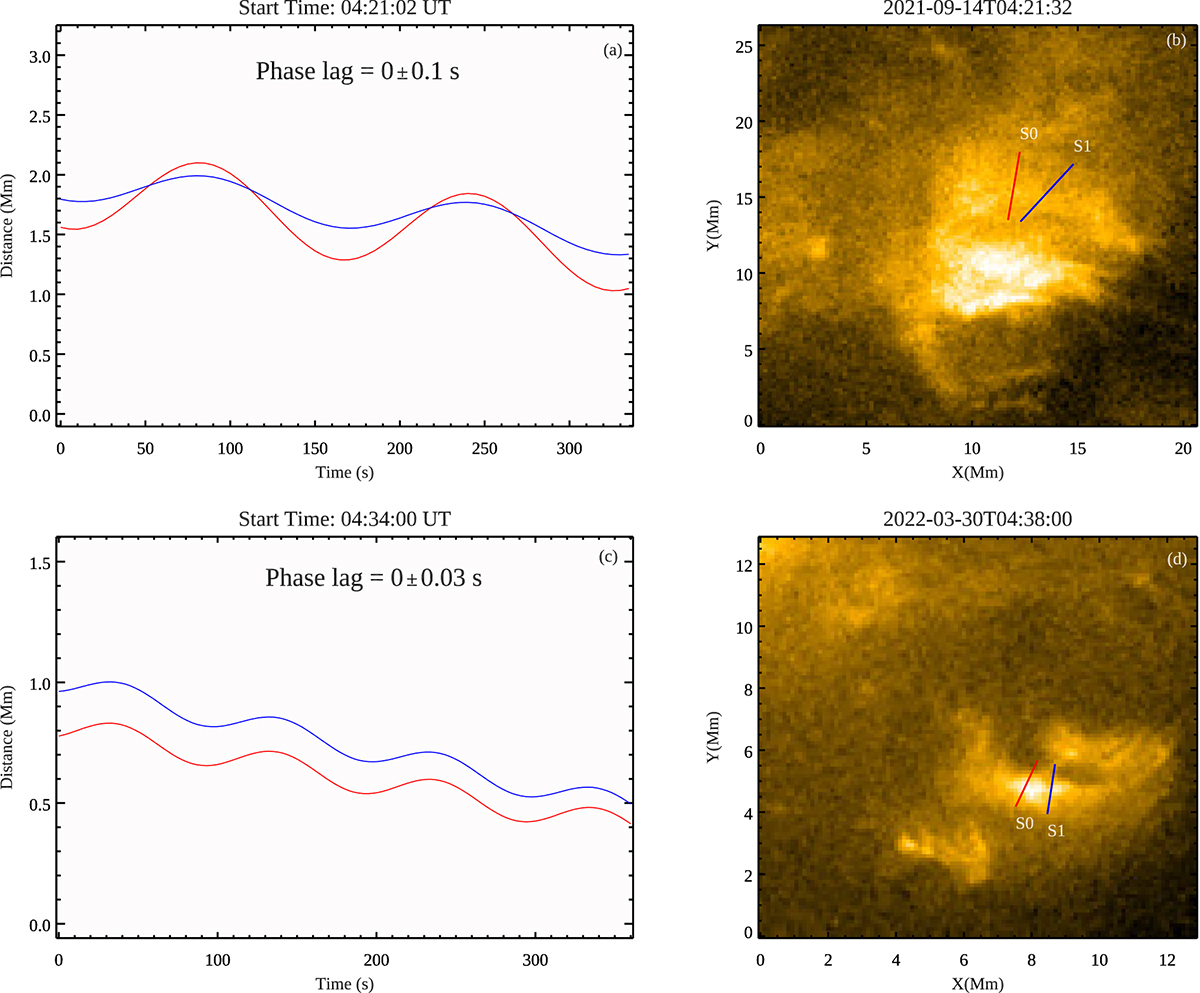
Fig. 7.
Download original image
Phase lag analysis of the oscillations. The figure presents the multi-slit analysis for the two loops shown in panels b and d. S0 and S1 are two slits that were placed at different positions of the loops. Panels a and c show the fitted oscillation profile from slits S0 and S1 indicated in panels b and d. The oscillations detected in S0 and S1 show no significant phase shift.
Current usage metrics show cumulative count of Article Views (full-text article views including HTML views, PDF and ePub downloads, according to the available data) and Abstracts Views on Vision4Press platform.
Data correspond to usage on the plateform after 2015. The current usage metrics is available 48-96 hours after online publication and is updated daily on week days.
Initial download of the metrics may take a while.