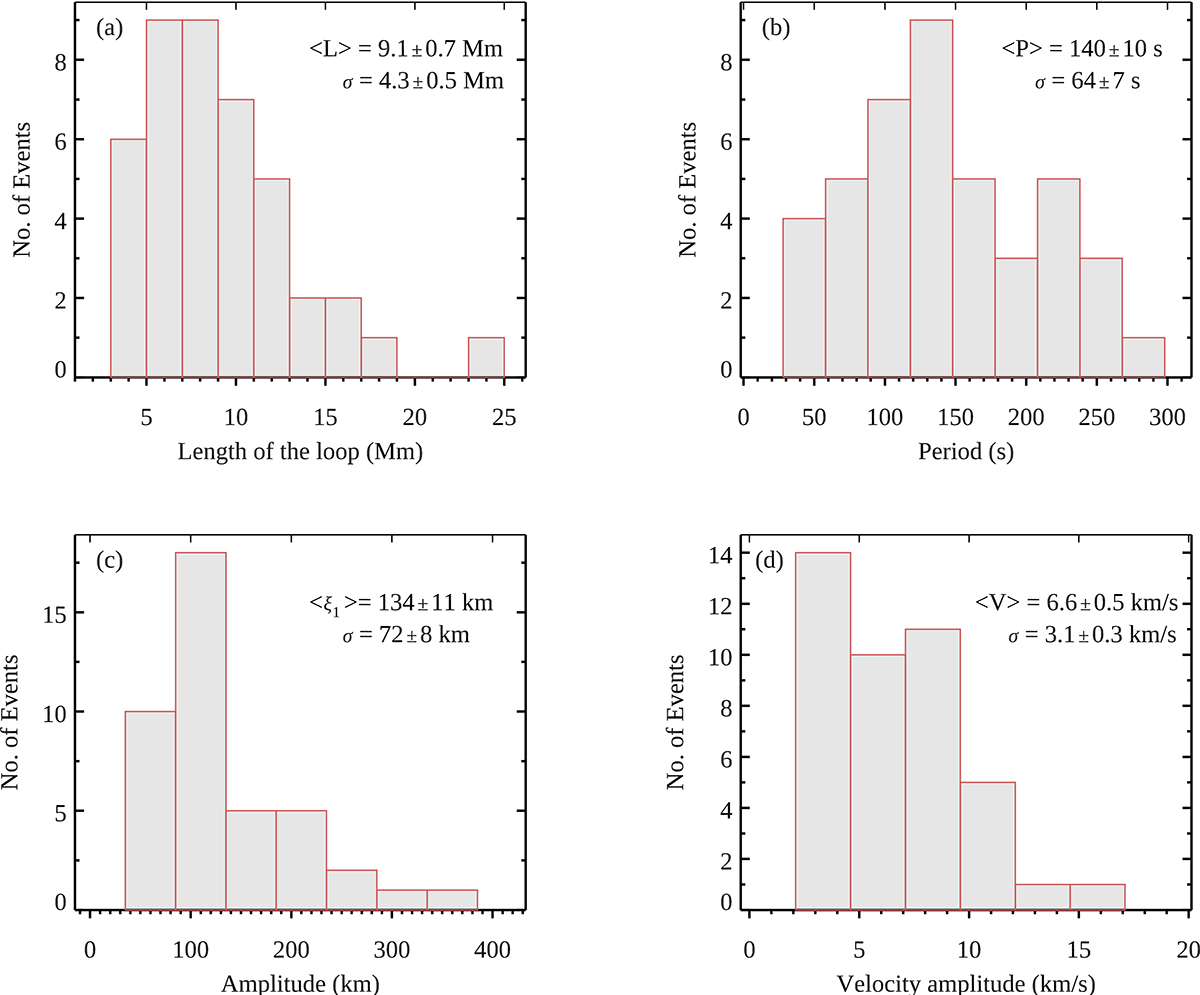
Fig. 3.
Download original image
Distribution of the oscillation parameters. The estimated parameter values are displayed as histograms, showing the distribution of (a) the loop length, (b) the period, (c) the displacement amplitude, and (d) the velocity amplitude. These histograms illustrate the range of values for each parameter. The average and standard deviation are provided in the respective panels. The plots also include the standard error in the mean and the standard deviation.
Current usage metrics show cumulative count of Article Views (full-text article views including HTML views, PDF and ePub downloads, according to the available data) and Abstracts Views on Vision4Press platform.
Data correspond to usage on the plateform after 2015. The current usage metrics is available 48-96 hours after online publication and is updated daily on week days.
Initial download of the metrics may take a while.