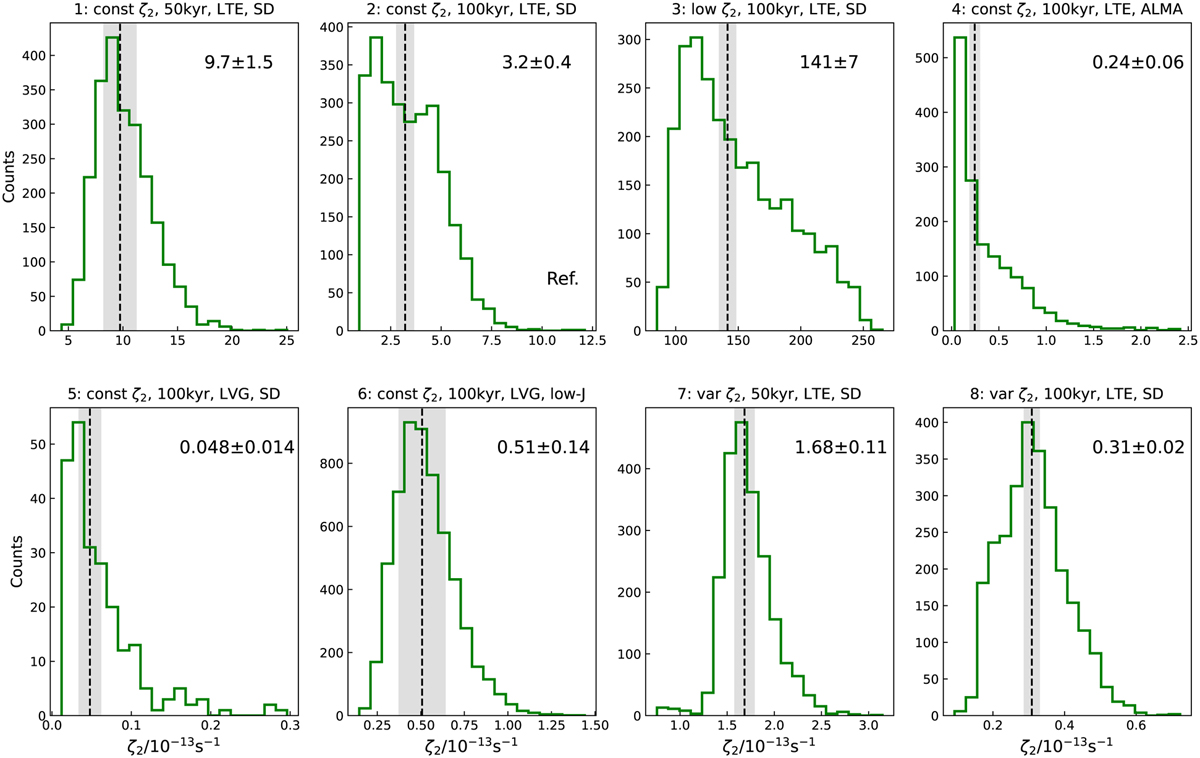
Fig. 7
Download original image
Same as Fig. 1, but the ionisation rate is estimated using the new formulation of the CWT98 method presented in Appendix B, summarised in Eq. (B.6). Note that the ζ2 values are normalised to 10−13 s−1 in all panels. The median (± median uncertainty) is reported in the top-right corner and shown with the vertical dashed line and shaded area in each panel. The reference run is labelled with "Ref" in the bottom-right corner.
Current usage metrics show cumulative count of Article Views (full-text article views including HTML views, PDF and ePub downloads, according to the available data) and Abstracts Views on Vision4Press platform.
Data correspond to usage on the plateform after 2015. The current usage metrics is available 48-96 hours after online publication and is updated daily on week days.
Initial download of the metrics may take a while.