Fig. 5
Download original image
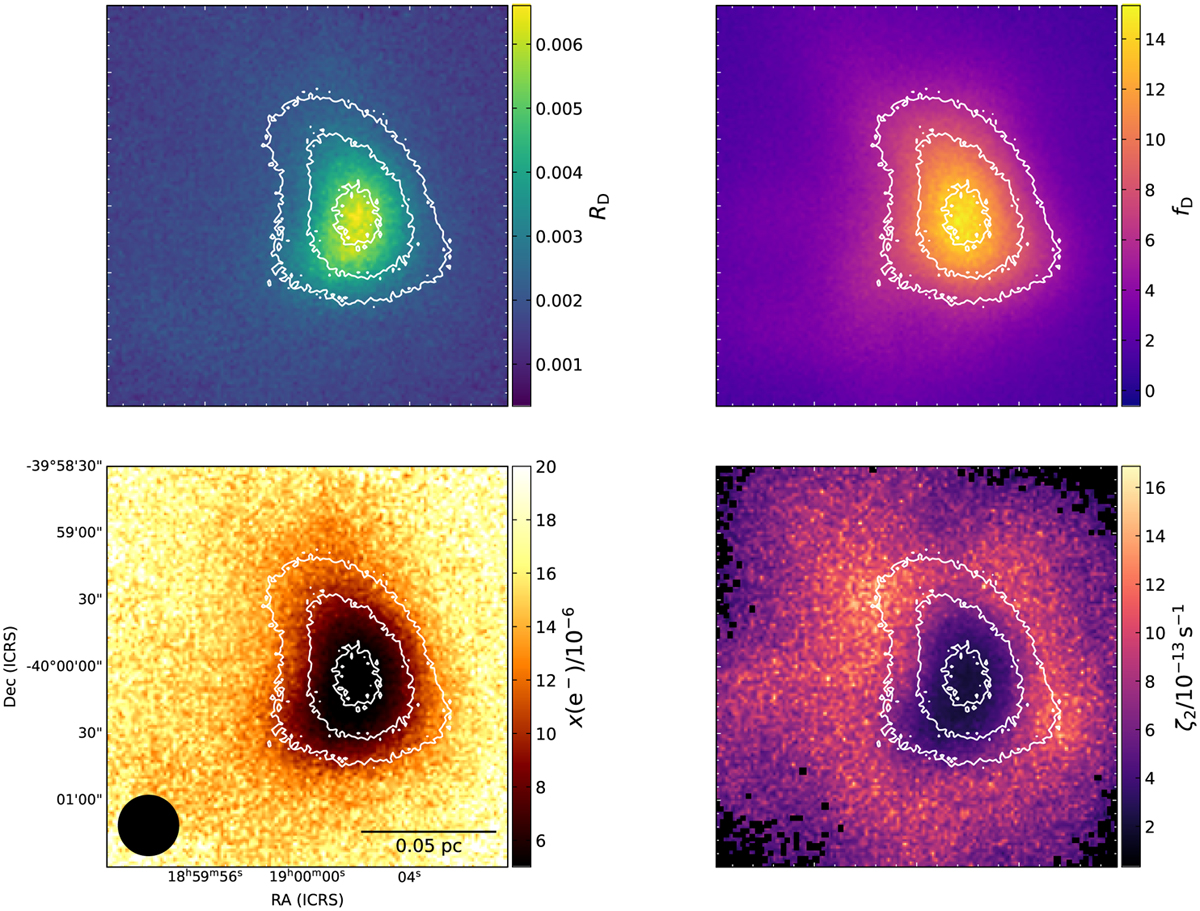
Maps of the key quantities employed by CWT98: DCO+ deuteration level (top-left panel), CO depletion factor (top-right), electronic fraction (bottom-left), and ζ2 (bottom-right). Note that the colour scales for the last two quantities are in units of 10−6 and 10−13 s−1, respectively. These maps assume the molecular column density and total gas column density derived in run 2. The mean uncertainties are 2.6 × 10⁻⁴ (RD), 0.3 (fD), 3 × 10⁻⁶ ![]() , and 1.5 × 10⁻¹³ s−1 (ζ2). The beam size and scalebar are shown in the bottom-left panel. The contours show N(H2), as in Fig. 2.
, and 1.5 × 10⁻¹³ s−1 (ζ2). The beam size and scalebar are shown in the bottom-left panel. The contours show N(H2), as in Fig. 2.
Current usage metrics show cumulative count of Article Views (full-text article views including HTML views, PDF and ePub downloads, according to the available data) and Abstracts Views on Vision4Press platform.
Data correspond to usage on the plateform after 2015. The current usage metrics is available 48-96 hours after online publication and is updated daily on week days.
Initial download of the metrics may take a while.