Fig. 3
Download original image
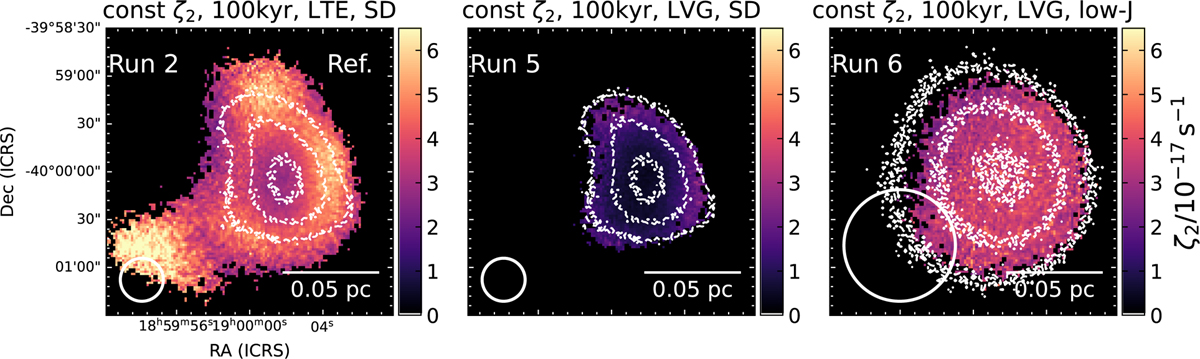
Summary of runs performed in LVG approximation, compared with the reference case (run 2, left panel). The central panel refers to the analysis performed on the high-J transitions for DCO+, H13CO+, and C18O, whilst the low-J ones are used in the map in the right panel. The white contours are the same as in Fig. 2. Note that the colour scale is the same across all the panels. The beam size and scalebar are shown in the bottom left and right corners of each panel.
Current usage metrics show cumulative count of Article Views (full-text article views including HTML views, PDF and ePub downloads, according to the available data) and Abstracts Views on Vision4Press platform.
Data correspond to usage on the plateform after 2015. The current usage metrics is available 48-96 hours after online publication and is updated daily on week days.
Initial download of the metrics may take a while.