Fig. 2
Download original image
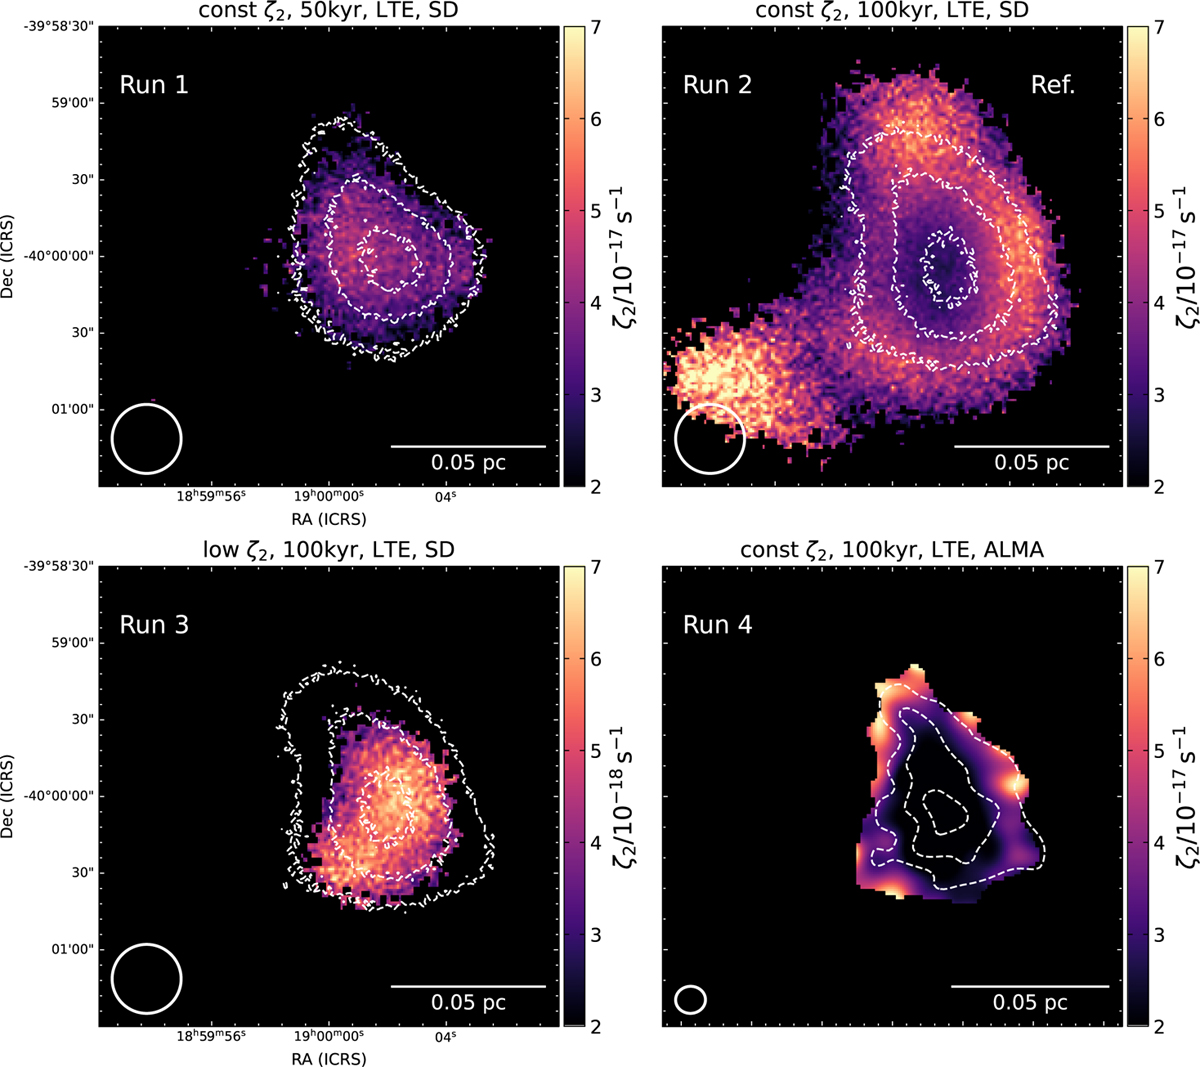
Resulting ζ2 maps obtained with Eq. (1) in runs 1 to 4. The run ID is reported in the top-left corner, and the key parameters are included at the top of each panel. Run 2 is taken as a reference throughout the rest of this work. The white contours show the 50, 70, and 90% of the N(H2) peaks, which are: 6.67 × 1022 cm−2 (core in single-dish like analysis at 100 kyr); 6.86 × 1022 cm−2 (core in single-dish-like analysis at 50 kyr); 2.51 × 1022 cm−2 (core in ALMAlike analysis at 100 kyr). The beam size and scalebar are shown in the bottom corners of each panel. Note that we show a zoom-in of the central 0.15 pc.
Current usage metrics show cumulative count of Article Views (full-text article views including HTML views, PDF and ePub downloads, according to the available data) and Abstracts Views on Vision4Press platform.
Data correspond to usage on the plateform after 2015. The current usage metrics is available 48-96 hours after online publication and is updated daily on week days.
Initial download of the metrics may take a while.