Fig. D.1
Download original image
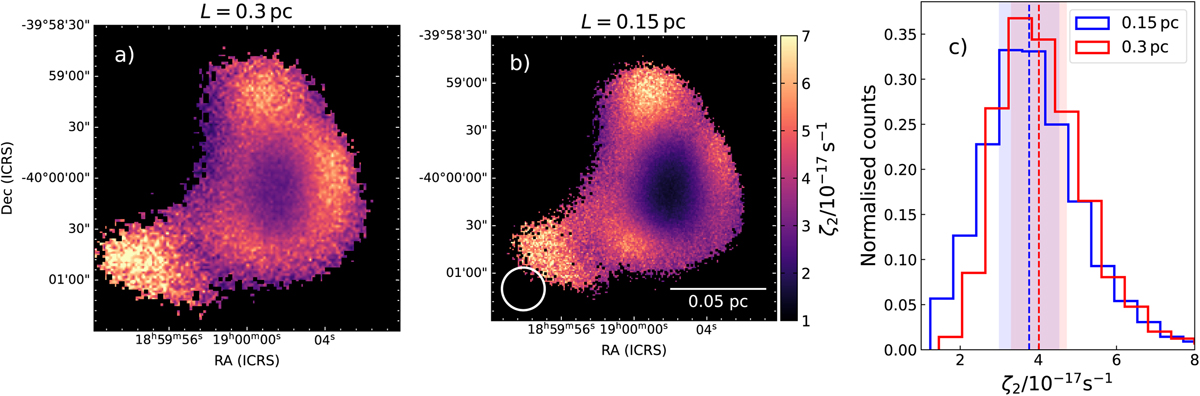
Comparison of the resulting ζ2 maps (in units of 10−17 s−1) on the two runs with distinct box sizes L but otherwise identical, using the BFL20 method. Panel a) shows the run with L = 0.3 pc (namely the reference run 2), and panel b) shows the results with L = 0.15 pc. The colorbar is kept fixed to ease the comparison. The histogram distributions are compared in panel c), labelled in the top-right corner. The median values (median uncertainties) are shown with the vertical dashed lines (shaded areas).
Current usage metrics show cumulative count of Article Views (full-text article views including HTML views, PDF and ePub downloads, according to the available data) and Abstracts Views on Vision4Press platform.
Data correspond to usage on the plateform after 2015. The current usage metrics is available 48-96 hours after online publication and is updated daily on week days.
Initial download of the metrics may take a while.