Fig. C.1
Download original image
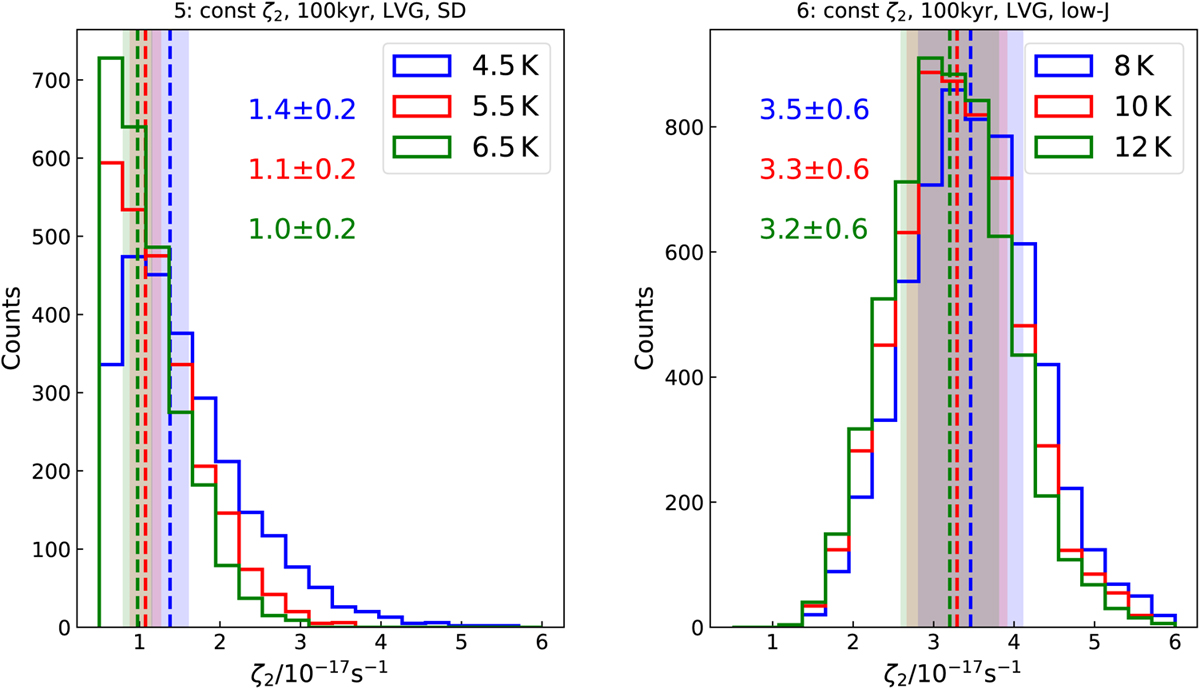
Histograms of the derived ζ2 values with the BFL20 method in run 5 (upper panel, high-J transitions) and run 6 (lower panel, low-J transitions). The different colours show different assumptions for the excitation temperature of DCO+ and H13CO+ (assumed to be equal). In particular, the reference values used in the main text are shown in red (hence these data are the same presented in Fig. 1), whilst the blue/green curves show a positive/negative variation of ≈20% of that value, respectively (labelled in the top-right corner of each panel). The median values and uncertainties are shown with the vertical dashed lines and shaded areas and with coloured text in each panel.
Current usage metrics show cumulative count of Article Views (full-text article views including HTML views, PDF and ePub downloads, according to the available data) and Abstracts Views on Vision4Press platform.
Data correspond to usage on the plateform after 2015. The current usage metrics is available 48-96 hours after online publication and is updated daily on week days.
Initial download of the metrics may take a while.